“A penny saved is a penny earned”
– Benjamin Franklin
When looking at your portfolio and investments it is up to you to decide when you’d like to be happy- in the short-term or the long-term. In this video we’ll take a look at a chart highlighting time, diversification and the volatility of returns. Spoiler alert: there is no right answer. But if you connect with me directly, I can help you identify what situation you’re most comfortable with and that would provide you with the best returns. Simply email me at mike@generositywealth.com to start the conversation.
Here is my video discussing long-term versus short-term investment and their happiness potential:
Warren Buffett “Never Invest in a Business You Cannot Understand”
Good advice.
I’m going to take it one step further and say “something” or “anything”.
I think Wall Street has created a lot of very creative financial products out there, and some of them are good while others are bad. Mostly it depends on which “tool” you need to meet your individual goals.
That being said, just because something is complicated doesn’t mean it’s better, and you should definitely understand it before investing in it.
That’s one of the jobs of your financial adviser, to help explain each investment you have, how it fits into the big picture, and the pros/cons of each one. Before you invest, be sure your questions are answered fully so you have confidence you’re making the right move!
It’s definitely something I live by, and I never recommend something to a client without full due diligence.
The first quarter was a great reaffirmation that diversification can be your friend. US Large company indexes lagged, but middle and small companies did better. US Bonds did well (in general), as did international stocks.
While diversification does not guarantee a positive return in a generally declining market, my experience is that it does tend to “buffer” some of the returns so you can stay with the plan that works for you.
In my video, I review the past quarter and continue my theme about what I’m watching to come to a “health” conclusion on the markets. Okay, I’m still bullish, but why you may ask? Click on the video for my thoughts and analysis.
There are few things as sweet as your first mention in the Wall Street Journal. March 10th was the day Mike Brady arrived in print!
Since I was written up in the TheSuit Magazine, I’ve had a number of requests for interviews, expert quotes, and general articles about how I interact with clients.
I provide distinction from others in my field in the relationships I build and how I focus on the “why”, vision, and goals. Activating your creative “right brain” is just as important as the logical “left brain”. I’ve been interviewed on this recently for a technical journal, and will share it with you once available.
Anyway, if you want to see your advisor/friend in the Wall Street Journal, I’m just a click away!
2014 is now over, and a new year is in front of us.
In my video (click on the image below), I briefly do a recap on 2014, and then lay out my arguments for a long term approach, diversification, and reasons why I think being fully invested is wise, particularly as I continue to be optimistic for the foreseeable future.
Click on the video below for 10 minutes of my thoughts.
Hi there! Mike Brady with Generosity Wealth Management: a comprehensive, full-service, wealth management firm headquartered right here in Boulder, Colorado.
Today want to talk about the 2014 review and the 2015 preview- spending most of the time, I think, on the preview.
2014 was a year that was not super high or super low- it was kind of right there in between. The large company unmanaged stock market indexes were in the low double digits-positive for this year. If there was a smaller company investment it was, in general, the single digits- on the low side- kind of low single digits.
Bonds, which I believe are essential for most portfolios-in 2014 they had the low to mid single digits. I’m going to use my hands here: I think a good portfolio of stocks and bonds kind of mesh together with some cash reserves- sort of those core holdings. One thing the bonds did this year [2014] they helped to reduce some of the volatility. If you are 100% stock market index, you’re really kind of all over the place. And in 2014 there was a 7% decline in the in the S&P throughout the year. It did, in the fourth-quarter, recover from that which is wonderful- so it is positive for the year.
I’m going to put a chart up on the screen of the S&P 500 going back to 1997. What you’re going to see is there is some huge advances; some declines; advances; declines, etc. I’m going to just put a circle where we are right now. You can see here, and I put a tiny little arrow next to it, where we have that 7% decline in 2014.
I’m going to put another chart up on the screen. Now you’re going to see what it looks like going all the way back hundred and fourteen years- back in 1900. You’re going to see there are some times of great advance- and it can happen over decades. There are times of consolidation over decades as well. You’re going to see over on the right side where we are now. So the question of ask yourself are we at a consolidated period? Are we at a time of great advance? Of course there could be a decline as well over many times. So this is the environment that we have to make this decision in.
It is normal for there to be dips throughout the year. As a matter-of-fact, going back to 1900, it’s normal for there to be about three dips of at least 5%- historically, that’s what happened. It’s normal for there to be a decline of at least 10% throughout the year when we look at the numbers going all the way back for a hundred and fourteen years. OK?
Time is one of our best advantages. My advice that I give to someone who needs money in a year or two is completely different than the advice that I give when we’re planning out five years, ten years, twenty or thirty. If you’re in your 60s or 70s, hopefully you’re going to live a long life. You still have a long time horizon, hopefully, of ten or twenty years. So the more that we can keep our eyes on what the goal is; Today is point A. Point B is in the future, to keep track of what our goals are in the future the happier we will probably be.
I’m going to put a chart up on the screen. It shows, in numbers, what I just talked about. This is sixty-three years. All the way back to the 1950 of one hundred percent stocks; one hundred percent bonds, and kind of a mishmash of the two. In each one of those groupings that goes from- on the left hand side- one year and on the right-hand side- 20 year rolling time period. You’re going to see that in each one of those groupings, there are three bars and the far right hand bar is a mash of stocks and bonds. The longer out we go, the longer our time horizon has been, the range of returns- the highs have gotten lower and the lows have gotten higher. So that there is a more comfortable range I would say. Kind of gets rid of the outliers of the top outliers on the bottom. And so time is, without question, a great advantage that we have going forward. And so I constantly remind clients of- “where are we going to?” and “What’s our goal?”, “What’s our endgame?” And so, how does one quarter, one year, really fit into the bigger picture of a decade, two decades etc.?
Before we start talking about the preview, let me just tell you that I am optimistic going forward. I do believe that we’re in the beginning of one of those nice big upward swings- that could be multiple years, multiple decades. That doesn’t mean it’s going to be perfect and it doesn’t mean it will be an absolute straight line but I am optimistic about that.
I wanted to read something that Warren Buffett said (one of the best investors in history) and I really have a lot of respect for him. It is this quote right here that he said in the fall of 2008. Just to refresh your memory, the fall of 2008 was horrible! And it continued into January and February of 2009. It was hard to find people who were optimistic at that point in time. What he said is this, “Let me be clear on one point: I can’t predict the short-term movements of the stock market. I haven’t the faintest idea as to whether stocks will be higher or lower a month- or year- from now. What is likely, however, is that the market will move higher, perhaps substantially so, well before sentiment or the economy turns up. So, if you wait for the robins, spring will be over.”
What’s really interesting is after he said that the market continued to go down another 20 or 30%. And he continued to make investments all the way down. And one of the best investments that he made was actually five months after the market completely bottomed out in March of 2009. But he was committed to his conviction that long-term investments in a portfolio, and he has a well balanced portfolio, was in his best interest and when I meeting with clients we talk about how that might be in their best interests as well.
I think that there are lagging and leading indicators. “Lagging” means that the end result. So let’s say that you think the markets go up. Well, we’re not going to know whether or not that’s true or not so we looked at historically. So that’s an indicator, whether it was up or down, after the fact and then it’s too late. I like to focus on some of the leading indicators. And two weeks ago I did a video which I highly recommend that you look at. It came out around December 19, 2014. So go to my webpage look at that blog or look at the archived news newsletters. (www.generositywealth.com) But at that time I talked about some of the leading indicators about why I optimistic as things go forward in adjusting my conversation with clients accordingly.
One of them is the S&P 500 P/E ratio. Right now it’s around 16%. As it creeps up towards 20 that’s going to be a major leading indicator for me as my optimism might go towards more pessimism. I’m also going to look at earnings per share- whether or not that’s going to drop. The 10 year yield on the treasury right now it’s at 2.18 as it gets closer to 3.5, 4.0 or 5.0, I think that is going to be something that will start to give us leading indications of some problems in the future.
Declining investments percentage as a percentage of the GDP and finally, China. You’ll notice that I talk about China primarily as it relates to their economy and the impact on the world. But if you’re looking there’s always a number of reasons not to invest, not to be optimistic. You can always find every year, and 2015 is going to be no different, a reason say, “well it’s different this time!” Well, what about North Korea? What about the Middle East? What about this, what about that? There’s always, and I can sit here and point to some event, that drive the market for a relatively short time. But long-term, the fundamentals of the market win out. And in my opinion the fundamentals are positive at this point. And I’m a believer, like Warren Buffett, that the market, in general, will be higher in the future than it is today. And so we have to create a portfolio that’s individualized for us, to make sure that our behavior allows us to stay invested in that.
Just a couple of other things before I say goodbye here today: I do believe that consumer spending growth will be good going forward- particularly with lower oil prices. I think that is going to be a very positive thing. And is core inflation going to be affected this next year or two? The 2% target from the Fed, I don’t think we’re going to get close to that. So I think that interest rates are going to continue to stay low through 2015 or maybe even in 2016. And this is ultimately, I think, a good thing for us. So these are some of my argument about why am optimistic. But, in general, I’m a very optimistic person about the long-term for this and I think that it’s my client’s best interest as well. But please, don’t make any decisions without your talking to your adviser, without talking with me. It’s real important to keep the long-term vision and in your mind. But you also have to define what those goals are. You’ve got to find something that allows you, from a behavior point of view, to stay true to what your core is. That’s my preview and my discussion today!
Always I love to hear from you!
Mike Brady, Generosity Wealth Management, 303-747-6455.
And you have a wonderful day! Give me a call at anytime.
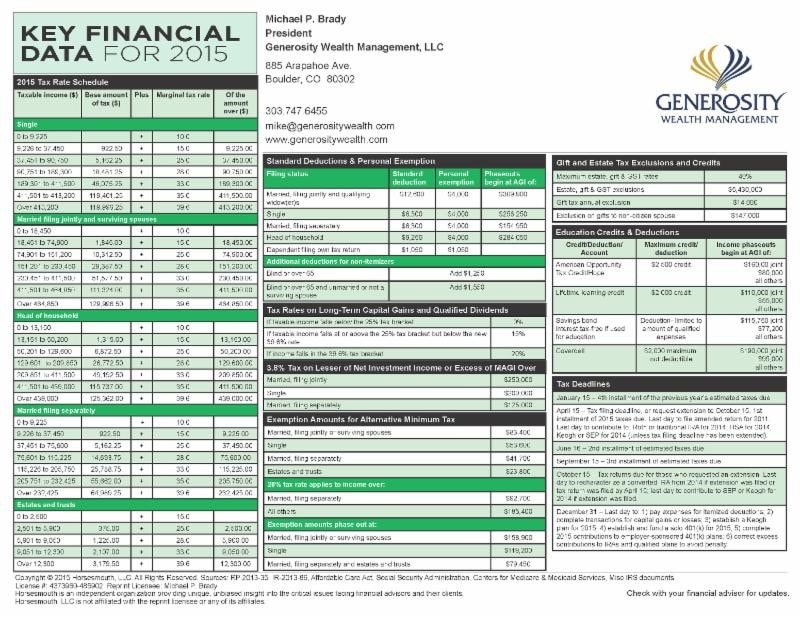
Back by popular demand is my Key Financial Information chart as a quick reference guide for you throughout the year.
I work with a number of good CPAs, so don’t hesitate to contact me for guidance as a good CPA can be a valuable member of your financial planning team.