“Twenty years from now you will be more disappointed by the things that you didn’t do than by the ones you did do, so throw off the bowlines, sail away from safe harbor, catch the trade winds in your sails. Explore, dream, discover.” – Mark Twain
The 1st quarter of 2018 is already over and it was an interesting 3 months to say the least. If we look at 2017, the fact that we had only a little bit of volatility is the exception. Most years there’s over ten percent declines at some point during the year. Which is something we’ve about hit already this year. That’s the normal and not anything to be freaked out about – listen to find out why.
Transcript of the video:
Hi there. Mike Brady with Generosity Wealth Management, a comprehensive, full service financial firm headquartered right here in Boulder, Colorado.
I’m here to talk about the first quarter review and the rest of the year preview. Charles Dickens in a Tale of Two Cities started off by saying it was the best of times and it was the worst of times. I suppose maybe we could start off that way with the first quarter as well. January for the unmanaged stock market indexes was a continuation of a strong upward movement that we saw in 2017 with very little volatility. That’s really one of the big stories as far as I’m concerned is that 2017 was so low volatile and that was the unique situation. All the way up to about January 26 of this year when volatility decided to come back. And so we definitely saw that in February. March looked like it was starting to come back up again and then we gave it away in the third week of March. And so the quarter ended a nine out of the eleven major S&P sectors, 9 of them were negative and two of them were positive. And those two that were positive was actually information technology and consumer discretionary. And so that’s kind of interesting.
Of the indexes, pretty much all of them were negative except for emerging markets and actually the NASDAQ. The NASDAQ unmanaged stock market index was positive. But even those that were negative in the U.S. here, not counting – I mean when you look at Japan and you look at some of the others abroad they were actually down quite a lot at negative seven percent or so. We were down one-and-a-half to two-and-a-half percent. That’s really breakeven in my mind, particularly when you can make a one percent move in a day which we definitely had some more one percent moves this past quarter than we had in quite some time in the last couple of years.
So it’s good to put this in perspective. The way I look at investments is that it’s three steps forward, one step back and maybe sometimes it’s two steps back. And if you focus so much on the negatives, on the steps back, then you’re never going to have the steps forward as well. And so when all this volatility is happening and let’s look at that chart that I have up on the screen. So you’re back to where you were three-and-a-half months ago. This is not that you’re back to where you were ten years ago.
Let’s put everything in perspective. As a matter of fact, it is normal for there to be volatility. It is normal for there to be declines. And with the number, the DOW being 25,000 and 26,000, 500 and 1,000 point movements are less significant as a percentage. So we have to look at things in percentages. I remember back in 1987, you know, I’m 49 years old right now and at that time I was a freshman in college when the October 1987 crash happened and that was 500 points. Well that was 20 to 25 percent of the whole market. Well, 500 points on 25,000 is not that statistically significant like it was 20 to 30 years ago. So the numbers get magnified just like our portfolios. The larger the numbers, of course, a percentage change one way or the other can be thousands, tens of thousands, maybe hundreds of thousands of dollars. And so we have to keep it in perspective from a percentage point of view.
I continue to be optimistic and that means not that I guarantee it, absolutely not. There’s no guarantees in this world. Life is not a guarantee. Investments are not a guarantee. I’m actually going to do a follow up video to this about how investing is like poker, not chess.
Just to give you a little preview of that. There are unforeseen things in poker and there is a certain amount of luck involved in poker whereas chess is all strategy. The better person should always win whereas that’s not the case in poker and that’s not the case in investments and that’s not the case in life. There are things that are unforeseen, things that we can do the best that we can. We can increase our probabilities of success. And so as I look towards the rest of the year I see lots of profitability with companies, I see lots of technical change continued. I believe that the tax change that just happened was a very favorable thing, at least in the short run and the short run being the next one to three to four years or so as cash comes back I’m sure, and we reinvest some of that cash as well. Other people might have a different point of view and that’s absolutely fine. That’s what’s great about America is that we can have different points of view.
You have to remember though that from a long term point of view which is the way we have to look at it, things are complicated. There’s many different variables that determine this. And so you might place a higher value on the variability of chaos as you might see it. You might place a higher value on tariffs and say wow, this is a bad thing. I don’t place that as high of a concern but maybe I’m wrong. Maybe you’re right, maybe you’re wrong. Maybe you get it. I just read this morning how Elizabeth Warren is in favor of the tariffs in China just like President Trump. I never thought the two of them would agree but there we go.
So it’s very interesting that there’s all these different variables. We have to remain long term investors because I can go back 25 years, I’ve been doing this 27 years, and go back my entire career and there’s always been a reason to be pessimistic. There’s always reasons to be optimistic and so the question is over a longer term – three years, five years, ten years, et cetera, what’s in your best favor because it’s very hard to read the tea leaves on a shorter term basis.
I’m optimistic. I continue to be so. I believe that there’s a greater than 50 percent probability that things are going to continue to work out fine. Maybe there’s going to be some increased volatility which is normal. The fact that we had only a little bit of volatility last year is the exception. Most years there’s over ten percent declines at some point during the year. And so we about hit that this year. So that’s the normal and not anything to be freaked out about.
Mike Brady, Generosity Wealth Management, 303-747-6455. Give me a call at any time. Thanks. Bye bye.
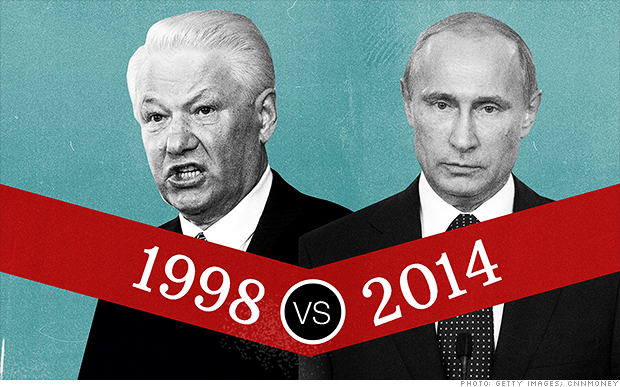
I remember the 1998 Russian crisis well. It was near the end of the summer, and threatened to put a real damper on an otherwise excellent stock market year. The “Moscow meltdown” bled over the S&P 500, which plunged 20%.
There are reasons 1998 and today are different
Tough sanction in place have somewhat isolated Western investors
Russia has a war chest of $416 billion in currency reserves today, versus very little in 1998
Russia’s currency is free floating, and not pegged to the US Dollar like in 1998. External shocks can be absorbed by the currency markets.
There are other worries in the world we can be concerned about, but Russia collapsing and spilling over to us like 1998 isn’t one of them.
When you hear 9 – 10% in the stock market, you must remember that those returns contain every single type of market environment.
Warren Buffet is one of the most successful investors ever, and he still has declines at some point. But, he has the right behaviors ingrained in him to “be greedy when others are fearful, and fearful when others are greedy”.
No one likes declines, but they are part of a full market cycle. When constructing a portfolio for a client, I always try to understand the risk tolerance for them, understanding that unless you’re 100% invested in the stock market, you won’t get 100% of the ups (desired) and downs (undesirable) of that market
One thing to watch out for is assuming the future will reflect the past. As a matter of fact, that whole “past performance is no guarantee of future result” is actually true.
So, looking at history over the past 14 to 15 years, what would happen with your returns and volatility if you had invested for the year based on the best asset class for the prior year?
Inquiring minds want to know.
Therefore, you should watch my video.
Hi there, Mike Brady with Generosity Wealth Management, a comprehensive full service wealth management firm headquartered right here in Boulder, Colorado. Today I want to talk about volatility, I want to talk about diversification and picking an asset class based on the prior year’s returns.
I was at a conference maybe two weeks ago, three weeks ago, something like that and this presenter had these charts, which I’m going to share with you today, that I thought were so fascinating. A lot of it has to do with setting yourself up for success. You’ve heard this if you’re watching my videos, as I certainly hope that you are, about setting yourself up for success because I’ve heard I just want the highest return, volatility doesn’t matter.
Well, my experience has been that volatility only matters when you’re right in the middle of it and it’s happening to you. Therefore, let’s set ourselves up for that success. I’m going to throw up here on the chart an example of all kinds of asset classes that you could have been in. You go back all those years and all the different colors and each one of them are stocks and bonds and international and commodities and all different types of asset classes. Now, let’s pretend like we’ve invested, so the highest one for each one of those years keeps changing because you can see that top row there the color keeps changing. If we took the previous year’s highest, the one who won for that year, and you invest in it the next year, what do you think would happen with your returns?
Well, this chart that I just threw up on the video will show you that the blue line there and this is a little bit cherry picking because this goes back to the beginning of 2000 and if you remember at that time it was right after the internet craze and I remember, I mean I’ve been doing this for 23 years, and the confidence level of all these people were oh my God, you’ve got to get into internet and you’ve got to do this, look at how great it did in ’97, ’98, ’99, I mean you’re a fool if you don’t do this. If you had done that, look at that blue line, the blue line is for the last 13 years if you had picked and invested your money into the previous year’s best asset class that’s what happens, okay. The red is if you invest in the worst asset class for the previous year, but if you invest in a diversified global diversified, meaning global stocks and bonds and some cash, then you’ve got that green one right in the middle. It’s not as good as going right into the worst. It’s definitely better than going into the best, but it also is a slightly smoother ride, which is absolutely essential.
This next graph I think is really interesting in that the red is the 100% stock market index. What would happen if you got only 50% of the decline so if it went down 50, you went down 25, and you only got 50% of the up so that it went twice as much up as you did, you would have that green versus the red, so the red is what you would have if it was $1000 or a million, it doesn’t really matter, but you would have a much higher rate of return with a lot less volatility just by having half of the down and half of the up because if you recall losing 50% means you have to have a 100% return just to break even. If you have $100 and you lose 50, that’s $50. You have to make 50 on 50 just to break even. If you lose 20% you have to make 25 just to get back, lose 33 you’ve got to make 50, that’s just the way math works.
There was one other chart that I really wanted to share with you. This chart right up there, this is my last one for the day, which is on the right-hand side there, the question is the cycle of emotion. You go through some caution, some confidence, enthusiasm and greed, and then you go to indifference, denial, etc., all the way down there, so our emotions. I’m a behavioral finance guy who’s interested in that, that some of the nontechnical aspects that we bring to investing are as important, if not more important than some of the technical aspects. I just acknowledge that and so I’m always wanting to set ourselves up for success. These are the types of things that I talk with clients about all the time and if you are not one of my clients I’d love to talk with you about it.
Mike Brady, Generosity Wealth Management, 303-747-6455. Have a great week. We’ll talk to you later. Bye-bye.