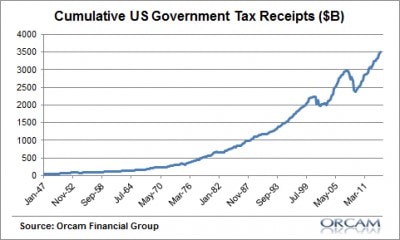
The deficit is the difference between tax receipts (inputs) and tax expenditures (outputs). The deficit has been declining over the past few years, but it’s not due to decreased expenditures, it’s due to increased revenues.
The private sector has been healing itself over the past 5 years, and it shows with the tax revenue.
There is so much in the news right now, most of it about the impending debt ceiling crisis. Most of what you read, hear, and watch is sensationalized (in my opinion), so in this quarter’s video I basically dissect where we are right now, paying attention to the data points that I think are relevant.
Being the contrarian I am, I also address some common, assumed facts or assumptions that I simply don’t believe.
A longer than normal video, but let me conclude by saying I’m still optimistic, and not freaked out (unlike pundits on TV).
Click on my video to get my thoughts
Transcript:
Hi, there, clients and friends. Mike Brady here with Generosity Wealth Management, a comprehensive, full-service wealth management firm headquartered right here in Boulder, Colorado.
Today is going to be a little bit longer video than is normal. This is a third quarter review and fourth quarter preview.
We’ve got about two and a half months left. You’re hearing all kinds of news—on TV, radio and print. I want to kind of debunk some of the things that you’re going to be hearing about. Because this session is going to be long and a little more technical and I might go a little bit faster just because I have so much to cover. I’m going to give you all of my conclusions right up front.
If you want to turn my video off in the next 30 to 60 seconds, you can.
Right off the bat, I’m not freaked out as in one of those just about to go off to this huge cliff in a week or even two or three weeks due to anything that the Congress is doing.
There is a momentum that is being built up on the private sector with available cash that we are going to I believe from an investment point of view come through this fine. It is not unusual for us to have various conflicts—whether or not it’s an international conflict or whether or not it’s our own Congress and the President having a dispute. I am not freaked out.
I’m going to debunk here in today’s video something that you might hear from an investment point of view and then we’re going to try to prove that and that seems a lot but here’s my summary is that a rising yield could not necessarily mean that the market’s going to go down and the bond markets in particular.
The economy—if the economy goes down or slows due to anything that the Federal Government might do, that does not mean that our markets are going to go down. The economy does not equate to the market. You felt that the last three or four or five years, the unmanaged stock market indexes have done very well, but yet the economy has muddled through and that’s just one proof. I’m going to give a few other proofs of that as well.
P. E. ratios are not everything. Consumer confidence is pretty much meaningless I my opinion. Warren Buffet is not infallible. He’s out there talking about certain things and sometimes I disagree with him. I think he’s a brilliant individual, but it doesn’t mean that he’s God and that everything that he says we have to take as God’s word.
I do believe that the increase in the U. S. debt as it relates to as a percentage of our national GDP over the long term does provide a headwind that will dampen some of the opportunities that we have in the investing community.
That is something that I think long-term, but it doesn’t mean that it happens next week. Doesn’t mean it happens next month.
Time is your friend and that declines are normal. If you have been watching my videos and if you are one of my clients, hopefully that you have a portfolio of stocks, bonds and cash. Sometimes the stocks do well. Sometimes the bonds do well. They kind of mesh together. You might have some satellite holdings as well.
Stick true to what is the investment strategy for you so that you can sleep well at night. Understand that everything that you hear on TV and the news is not necessarily the truths and that in my opinion, the sky is not falling no matter what they want you all to believe.
If you want to turn off the video, that’s fine; but now we’re going to talk about it a little bit more in-depth with lots of facts to prove—I don’t know about prove—but to give some analysis to you about why I’ve come to the conclusion that I have. My clients expect me to give them straight answers. If I don’t know I tell them I don’t know.
The market has a tendency to go up, sometimes it goes down and sometimes it consolidates. Up, down, sideways. Those are the only three ways that it can go.
Up on the screen right now, you’re going to see it for the last 112 years. You’re going to see times when it has consolidated. You can see times when it has advanced and at times it has declined, but it has recovered.
Time is definitely in your favor as an investor. One thing you have to ask yourself is are you an investor or are you a speculator? Time is something that hopefully we all have, even if you’re going to retire next year. Even if you just retired or are in the middle of retirement. Hopefully, you’ve got a long life expectancy. So, not outliving your money is one of your goals; but also possibly grabbing income from it.
One thing as you look at that graph right there is you’re going to see the last 12 or 13 years. The question is that a consolidation or are we about to take off into one of those advances? Nobody knows 100% for sure, but I am more in the optimistic mode than I am in the “let’s jump off the ledge” and everything is going to be horrible.
Here it is over the last 13 years or so. You’re going to see up, down, up, down, etc. That last little bit is about March of 2009. I think we all know that friend, perhaps you were it and said oh my gosh, the market can’t continue to go up as it goes through the Dow went through 10,000, 11,000, 12,000, 13,000, 14,000, etc.
Sometimes it would go back down and that person would say, see I told you. I told you it was going to go down. Well, you know what, this is the same person who might have been in cash the entire time and this is the up and the down. Declines are a part of the market. As I mentioned, it goes up, down and sideways. You’ve got to be willing to take all three of those and you can’t expect for it always at all times to go just straight up.
The economy does not necessarily mean that the market will do the same thing and that they correlate and go in the same movement. If what happens with the debt ceiling slows down the economy in some way, which I don’t know that’s going to happen. There is certainly a lot of pundants out there who seem to know exactly what’s going to happen, either on the left hand or the right hand, what’s going to happen.
I don’t know. I just admit that, but here up on the sheet there, you’re going to see as an example of what I’ve just said, unmanaged stock market returns from various countries, Europe, Pacific, France and Germany and Brazil and Russia and you’re going to see that a lot of them are double digits. I’m going to tell you that Europe is very sick from an economy point of view.
This graph right there and that which I’ve circled, you’re going to see that in the last two or three years or so, we’ve had a declining year-over-year percentage return on the GDP for Europe as just one example. You’re going to see that on the right hand side that unemployment is in the double digits for Europe.
The economy does not necessarily mean that the market is going to go down if the economy goes down. It is definitely a headwind and I’d rather have it as a tailwind, something to help. If all other things—the amount of cash that’s in the economy—if other factors are pushing things so that the investments are going up, then the economy might be holding it down a little bit, but it doesn’t mean that perhaps there’s so much momentum on the investing side that it overcomes any other factors might have on it. It’s not just that oh, this is the negative. Wait a second. There are some positives as well.
The question is how does it net out? Some people might say the headwind from a bad economy or something that the government might do is going to negate all of the amount of cash that we’ve built up and all the balance sheets that are in corporations. The holding invasion is going on right now. I’m just not in that particular camp.
Another thing you can hear an awful lot about is the Fed. We have a new nominee. Her name is Yellen. They’re going to call her the dove because she will very likely keep a very loose monetary policy, meaning that there’s going to be lots of cash available for loaning and she’s very accommodating towards that. If the economy does have a tendency to slow down and muddle through, my guess would be that she’s going to maintain that low interest rate and maybe even increase some of those bond purchases. We’ll have to see, but I think our loose monetary policy is going to continue.
Interest rate yields have been increasing significantly in the last month. Here’s a graph here showing over the last 20 or 30 years or so, even longer than that, you can see that they’ve really gone down during that timeframe. Yet in the last two, three, four or five months, it has increased. However, just because the yield on the 10-year right now is around 2.64% or 2.65%, it’s not until it gets around 5% historically that has really caused a negative impact to the degree that while if it is continuing to increase, the market is going down.
You’ll see that on this graph right here. There’s a lot of number there. Essentially what you are seeing there is that dotted line right there in the middle is the 5% mark. As the interest rates continue to go up, the yield, the unmanaged stock market indexes went up as well.
Only once when it hit over 5% did it cause such a drag on the available capital for investment and for improvement that it started to hurt the U. S. stock market. We’re still far from that at 2.64, give or take. That’s what it is as of Thursday when I’m doing this video.
Another thing that I want to talk about is you’re going to hear about consumer confidence and that consumer confidence is up or is falling, etc.
I put no credence on consumer confidence. I’m putting that chart up there. You’re going to see that sometimes with consumer confidence that is low is when you would have liked to have invested 100%. Sometimes when it’s high, it’s a lagging indicator and people feel really good about things.
By the way, the University of Michigan only surveys 300 to 500 people on one day over the month. So it’s not a very big sample in my opinion and I put no…I don’t care. I don’t care about the consumer confidence and hopefully, you don’t care as well.
You’re going to see right here on this map graphically people are feeling good right now and it’s because we’ve had a little bit of a housing bump up in the last two or three years or so. That is one more proof that interest rates are probably going to remain very low because we have a housing recovery. People are feeling really good and they have a hard time seeing how they’re going to increase the rate from the Fed in a very short timeframe.
That and the fact that we have so much federal debt out there that we have to finance, we have to keep the rate at a very low rate. I do believe that’s probably going to stay low.
I do think that it’s very reasonable for companies to have accumulated corporate cash over the last two, three or four years. Right here on this next graph, you’re going to see deploying corporate cash at that very high level. Companies have been very rational in keeping their cash ready to invest when they sense. This is a good thing.
In cash return, the shareholders are also at a very high level. The amount of dividends that are paid out. There’s a lot of cash out there for those investors on the sidelines ready to jump in.
You’re going to hear a little bit about P. E. ratios and other things. Right now, I’m not concerned that it’s too low or too high.
I think it’s going to be just fine. This graph right up there. You’re going to see that when that dotted line from top to bottom there. Many times when it’s at this level, the returns for the stock market indexes have been positive. Sometimes they’ve been negative. You can see that. A large preponderance of them have been up on the top side. Only when it gets up to a 20 and 30 time does it really, really get way out of whack.
The next thing I want to talk about is that I do believe that Warren Buffet has been talking about the U. S. debt as a percentage of our GDP which is really our national income for the country not concerning to him.
Right now, it’s at about 102% or 104% and I do think that long-term, it provides a headwind against the investing and the ability of that particular country in order to move forward because it is, of course, sucking out the available capital to finance that particular tax.
You’re going to see here on this graph that I’ve just put up there that the U. S. is kind of on the right-hand side of that 100 mark. You’ll see that as you go down, Greece and Portugal and some other countries that are really an absolute mess as their debt got bigger and bigger and bigger. It’s not by the size, by the way. That’s what the yield is. The yield comes after some of the problems.
For right now, just really look at how the U. S. is on the right hand side of that vertical line, which is not the side that we really, really want to be on.
At this point, I do want to start summarizing which is time is your friend. On this graph right up there, you’re going to see is a depiction. The green is the range over the last 52 or 53 years of the unmanaged stock market index. It’s very high and very low.
Bonds, high and low.
Then we have a 50/50 mash of the two.
What you’ve seen is on an annualized basis, when you get out to five years, ten years and even twenty years, you have a normalizing return. You’re also seeing that they have a tendency and historically have been and that’s the only thing we have to go on. The future could be different, but historically what has happened is that those returns those people have been patient for five years, ten years and twenty years have had positive returns or even break even. There are not that may opportunities over a very long timeframe for there to be a decline.
One of the frustrating things is with this low interest rate environment, the options are very few I should say.
CDs and your money markets are hardly paying anything.
Bonds have a very low yield at this point. Unfortunately, many of us have been moved towards higher risks that we might not otherwise have taken.
Coming to a conclusion here, the last chart I want to show is right up there on the screen. It is the annual return. It is normal for there to be declines throughout the year. This year, believe it or not, has had from a top to a bottom, an unusually low top-to-bottom draw down. It has either been more up or sideways this year. Not a lot of huge decline on the down side.
It does not mean that when there’s a draw-down throughout the year that the year was all negative or that everything is just going to heck.
This graph is very important because we as investors who are in it for the long term who have hopefully created a portfolio that’s consistent with our risk levels and our objectives, etc. We have to understand that there will be some volatility in the market.
If you can’t handle that, we have to really seriously evaluate the strategy that you have. That is what I have here today.
Please give me a call if there are any concerns whatsoever. I can talk your ear off about some of my thoughts as we go forward and strategies that we should have or could have.
Mike Brady, Generosity Wealth Management, 303-747-6455.
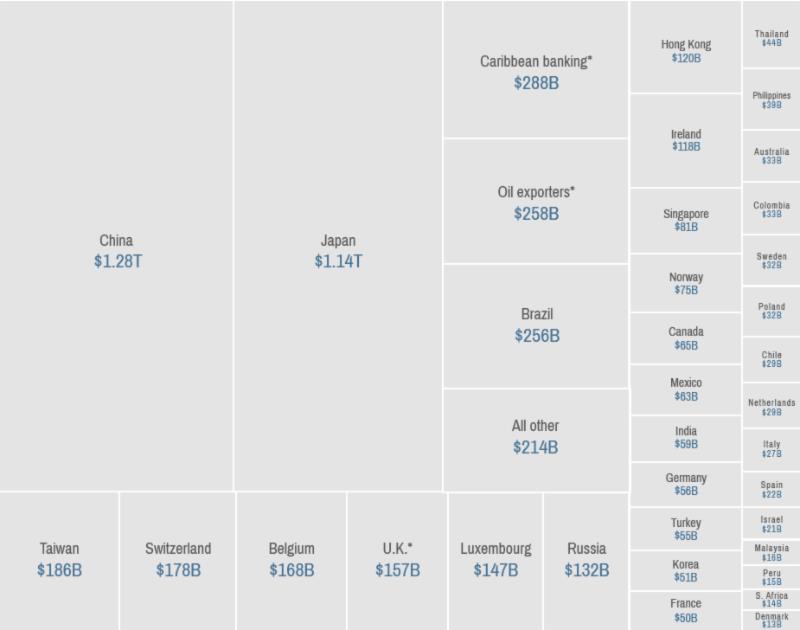
There’s a perception China owns all of the Treasury Bonds, but they actually own less than 10%. The biggest single owner of US Federal Debt is the Federal Reserve Bank.
The above graph shows foreign holders of our debt.
Good morning. Mike Brady with Generosity Wealth Management, a comprehensive full service wealth management firm here in Boulder, Colorado, and I am so pleased to talk with you this morning because we’re going to talk a little bit about the first quarter of 2013. We’re going to talk about the rest of the year. We’re also going to talk about unintended consequences, and I’ll talk about what I mean by unintended consequences in just a little bit.
First quarter of 2013, very good quarter, particularly if you’re 100% invested in the S&P 500 (which you probably shouldn’t be), and very disappointing for you if you’re 100% invested in wheat futures (which you probably shouldn’t be). Realistically you hopefully have a well diversified portfolio of stocks and bonds and cash in US and international, something that fits well with you with your risk tolerance level. If you’re my client, of course I’ve talked with you about that. If you’re not my client, well gosh darnit, you should call me so I can work with you on that.
I’m going to put up on the chart there something that might be a little difficult so I’m going to put a link to it so you can grab the high definition JPEG of it, but you’re going to see across the gamut there, from on the left you’re going to see the S&P 500 all the way to the wheat futures there on the right, all kinds of ranges from – from very good double digits in the positive to for the unmanaged stock impact indexes to double digit negatives for those – those evil wheat futures.
I’m always reminded that like predicting the weather, predicting the economy and predicting the markets, et cetera, is a very complicated proposal. No one is absolutely right, and there’s many different variables that go into it. The older I get, the more humble I become, and at the beginning of the year I said that I thought that this was going to be an up and down couple of years, that it’s going to be a trading range, and I was asked by a client last week if I was surprised by the first quarter strength and the answer is I was surprised but one quarter does not a year make. One quarter does not a two-year time frame make, and I hold to that.
I think that going forward there are so many pieces of data that are negative, there are so many pieces of data that are positive, and that’s normal. When someone says to you, if you see some kind of a TV pundit or an analyst that, well, all these, we have conflicting data. Well, there’s always conflicting data. There’s never 100% way or the other. We have to become comfortable with that type of chaos, and we I think have to take all the data in and say, okay, what does it really mean? And for me it means that it’s going to continue to be that muddle through.
One thing that does concern me from an economy point of view is it feels like a very sluggish economy. The participation rate from an employee point of view, I’m going to throw a chart up there, continues to discourage employees. That being said, I don’t take the complete pessimist view, because we knew this going back that there’s going to be so many baby boomers exiting the work force, so we knew this. Remember that book back in the early 2000s, The Roaring 2000s by Harry Dent, he talked about how around this time frame there are going to be a lot of people exiting the work force and starting to withdraw money from the market. That being said, I think that if you talk with some of your friends and family members, you probably know people who have tried to get a full time job that have decided to go back to school or decided to take something that is less than full employment or what they’re looking for, so it’s a combination of those two, and at various points in time we have a major shift change, and I think that we’re going through that right now and have been for the last two, three, four years, of what does it really mean to be fully employed? What skill levels are we as a society needing in some of those high tech and creative positions? And so that’s what we’re seeing right now. It’s always painful when we go through it, but I’m ultimately an optimist on the US and how we solve things and our ability to weather many things.
Now, I want to talk about unintended consequences. The unintended consequence from August of 2011, remember what we were talking at that point about the down grade of the US from triple A down to double A, and everyone said oh, my gosh, no one’s going to want our treasuries. Well, the exact opposite happened and people basically looked at, investors looked at all of their options and said, you know, this can have a huge impact on some of these other asset classes. I actually want the treasuries which look the best horse in the glue factory, and so that’s exactly what happened. There was a huge rally in the treasuries. I think about, and this is a slight tangent, but I think about Kenya about four or five years ago. I think many of you know that I go to East Africa for two to three weeks a year and do some charity work there, and in Kenya they had a riot after one of the elections and it cut off the whole, you know, Rwanda and Uganda from the ability to get fuel and to get other goods and services because they were coming through Kenya. Well, what was the unintended consequence of that? Now there’s a huge pipeline and rail that’s going through Tanzania that completely bypassed – they’re going to completely bypass and have as a secondary something that’s not Kenyan. That’s really going to long term hurt Kenya, who had a monopoly on getting goods and services in there.
The reason why I bring that up is let’s look at what happened with Cyprus and the European monetary union. Essentially the Cyprus banks decided to treat their depositors as investors in the bank, saying, well we’ve lost all this other money, we can’t – we’re having real difficulty, and the European monetary – European Union is basically saying well, you got us tickets to those uninsured depositors. Now, if you were a depositor of a large amount, you think that’s not going to cause some concern down the road? I mean, I think this is probably the end of the Cyprus banks there, and it also had an unintended consequence of everyone else who is looking at the investing, not investing but depositing banks and European banks is that the European Union said, you know what? This country, the next time Italy comes around, the next time Portugal or Spain comes around, or Ireland, you know, you’re on your own. It’s up to the country. We’re not unified as a European monetary union, unlike what we have here in the United States.
So I think that the unintended consequence of that is a further segregation of the banking system and financial system in Europe that’s just going to speed along what we’ve been talking about for two to three years. Whether all that money that was part there now comes towards the US banks is still to be seen. That being said, I actually think the US financial system is still sick, I mean there seemed to be no consequences for bad action and bad investments even here in the United States, and this is something that we’re going to have to pay at some point as a society and as tax payers, and I don’t know when that’s going to be, whether it’s one quarter, two quarters, two years, or within ten years, but that is something that is going to have to be addressed at some point.
What does this mean for 2013/2014? I continue to believe in the trading range and that we need to be prepared for some up and down movement in the next year and a half, year to year and a half to two years. If you’re my client, of course I’ve talked with you about it. I met with pretty much all the clients in the first quarter and I tried to recommend managers and third party managers that I believe do well in that type of market.
I’m going to put up there on the chart a long term 110-year, 113-year view of the market, and the longer the time horizon that you have as an investor, the happier you’re going to be. If you’re a minute by minute, if you’re an hour, a day, a week, a month, those are hugely short times frames, and what we want to do is have investments that do well on the yearly, the two, the five, and the ten-year time horizon, and if we can have decade time horizon, you’re going to be a very happy, happy camper.
Before I end here, I’m going to throw a couple more charts up to show you what Europe looked like in the first quarter. You’re going to see that Europe was definitely trailing the S&P 500. You’re going to see that the financials trailed all the European stock market indexes, the unmanaged stock market indexes even more, and going forward I think that we need to be prepared for some volatility. We have to remain diversified, and we have to remain consistent with the risk level that we need for the plan that you hopefully have in place. The reason why I say the plan that you hopefully have in place is you’ve got to know where you’re going, you’ve got to have that nice retirement analysis and plan, and what risk level do you need? Because if you only need 2 to 3% a year and you’re taking risks that can get you 10 or 12% in a good year but also lose it in another, why are you taking all of that risk? And so I think that that’s something that you need to keep in mind.
I’m going to wrap up now, because it feels like I’ve been talking for awhile. I’m going to be a little bit more consistent with my videos going forward because gosh darnit, this first quarter was so busy for me as I was meeting with my existing clients and meeting with new people, that I didn’t have – I felt like I was communicating one on one all the time but I wasn’t doing as good of a job with my newsletters and my videos, and I’m going to get back to that, so you’ll see an awful lot going forward.
I am taking new clients. I would love for you to give my name out to your friends and colleagues and family members, et cetera, have them give me a call. We’ll have a conversation whether or not it makes sense for us to sit down and whether I’m the right guy to help them out. What people want, I can’t help everyone, so what they might need might not be what I do, and I’ll be very blunt about that and then very timely of course, but I’ll try to point them in the right direction.
Mike Brady, Generosity Wealth Management, 303-747-6455. You have a wonderful week, wonderful quarter. Thanks, good-bye.
2012 had some ups and downs, but ended up in the positive territory for the un-managed stock market indexes.
My outlook for 2013 is not quite as optimistic as it’s been the past few years for a number of reasons.
In my video, I recap 2012, provide some thoughts on 2013, and discuss my philosophy how different strategies should be considered going forward.
TRANSCRIPT:
Good morning! Mike Brady with Generosity Wealth Management, a full-service, comprehensive wealth management firm headquartered right here in Boulder, Colorado, and I am the President.
Today, I would like to talk with you about 2012, a little bit of a recap. We’ll also talk about the outlook for 2013 and what my analysis and what my opinion might be on 2013. Before I go any further, there will be a discussion here at my office, 45 minutes to 60 minutes, a seminar on the Outlook for 2013 on January 30, 2013, at 6 p.m. If you are interested in coming to that, please RSVP with Cassidy@generositywealth.com or you can call my offices: 303-747-6455. I will be sending out an invitation as well within a week or so.
Let’s look at 2012. I’m going to flip up there on the screen and you’re going to see the unmanaged stock market index for 2012. The first quarter was good. The second quarter was bad. Third was good and fourth pretty much held its own, although November wasn’t looking so good.
For the first quarter what you’ll see is if you missed January, you missed some of that first quarter’s gain and the second quarter was a tough one. That was very uncomfortable at that time. And when things like that happen (I’m going to throw up on the chart there again, there we go.) What you’ll see is it is common throughout the year for there to be declines. This does not mean that the year will end a decline. When those things happen, people have a tendency to get concerned, maybe even freak out. Last year was at 10%. The year before, it was 19% and then it was a16% decline. Three years ago, 28%. It is common for there to be a decline throughout the year.
At the end of the year, we had all of the election discussion. In case you haven’t been paying attention, President Obama did win re-election and then we went right into the fiscal cliff; right at the end of the year.
This video is really not so much about all the intricacies of the fiscal cliff and what was decided there. But in general, most people from a marginal tax bracket were not hit—39.6% for the highest tax bracket, if you’re at $400,000 or $450,000 income or greater, whether you’re single or married.
The capital gains and the dividends stayed the same for most people, except it’s now 20% for those at the highest rate. That does not mean that you are completely avoided any additional taxes. Before I go into that, there’s also a $5,250,000 exemption on estate tax and that rate did go up from 35% to 40%. However, there is a 3.8% tax for ObamaCare and the payroll tax that was 2% about a year ago, kind of a tax break, that was allowed to lapse. The full 6.2% of the employee portion of it is now going to be taken out of your paycheck going forward. You’re still going to see some kind of a tax bite at all the various ranges and income levels.
Last year there was also a little bit of a calming over in Europe but it is still, particularly in the credit market, but it is still disaster over there from a mid- to a long-term.
Let’s start talking about where we are right now in 2013. The last two or three years, I’ve been optimistic. You look back at the videos, you look back to my newsletters and you’re going to see that. I’ve always said that a diversified portfolio, while it does not guarantee a positive return, does not guarantee, particularly, in a generally trending down market that you know the perfect scenario on the outside, I do believe that it is a key ingredient to going from point A to point B in your goal planning.
Goal planning is really going from point A to point B, identifying those financial events that might knock you off and might derail you from getting to what your goal is, whatever that might be, and proactively addressing it and seeing if there is anything you can do to mitigate it.
There are a couple of different strategies from an investment management point of view as I like to think of it. There is sailing, which is like sailing your boat and then there’s rowing, like “row, row, row your boat.” Sailing and rowing.
Sailing is a little bit more passive than rowing and just think about the wind blowing it. If the wind is going in your direction, things are good and it is very forgiving of any errors you might have. The wind stops, you stop; the wind goes the other way, you might be going backwards.
If we’re in a generally upward market, this might be a good way to have your portfolio. The last two or three years, I felt comfortable, depending on the client of course. I am always making sure that it’s an individualized portfolio for them to meet their investment objectives, having less of an active trading strategy in there. Yes, we would move and allocate appropriately as the year unfolded, but it’s been very forgiving of any mistakes.
I believe in 2013 and looking into 2014, we’re going to be more of a trading range and that we might want to add in and complement some of our sailing strategies, some of our diversified asset allocation strategies with some managers who have a good track record of being a little bit more active.
Why do I think that? I think that 2013 and 2014, we’re already seeing that taxes are going up. I already mentioned that earlier. You’ve got the payroll tax, the ObamaCare tax and that is going to lead to some less disposable income.
I’m going to put up here on the chart, we’re going to see what some inflection points are and how things have looked in the last 10 years or so. From a technical point of view, we’ve had a great run in the last three or four years. The question is, are things going to continue to go straight up?
We’ve practically, in an unmanaged stock market index, doubled in the last three or four years. In the next three or four years, are we going to double? Is it going to be quite as easy? I’m a little hesitant to say something like that.
Earnings growth for the fourth quarter has not released, but it’s expected to be down. Manufacturing inventories are up, which is a bad thing. While forward PE ratios* I take with a grain of salt, the price to earnings growth ratio is higher, which is a negative thing which basically means the pricing market in relation to the expected growth.
PE ratios are higher now than they were a year, and even two years, ago. While the debt to GDP ratio for the federal government is about 103% which in my opinion, is in a danger zone. Not to make this into a political video, whether it’s a revenue or a spending problem depending on what your philosophical views are–Democrat, Republican, whatever it might be—everyone is agreeing that having too much debt is a problem. I think that we’re getting into a danger zone, particularly that debt in relation to the Gross Domestic Product (the GDP). That has me concerned.
Profits are good for corporations. They’ve been very efficient and have really cut a lot of their expenses. They are really trying to get “bare bones” in the last two or three years, which I think is great. The amount of cash that they’re holding on their balance sheets is good and high. But the question is with some bumps in the economy going forward, how much of a buffer do they have in order to ride it out? My concern is that they might not have quite as much of a buffer as we would like and what they’ve had in the past to cut expenses than they did in the last two or three years.
One of the big pieces of news in the last month that was really overshadowed by the fiscal cliff discussion was the Fed saying that they would like to phase out some of the quantitative easing in 18 to 24 months. They even pegged that 7.5% unemployment is something that would cause them to change their strategy. Whether or not what they say in their notes and what they’re actually going to do, that could be two different things.
Even Bill Gross, who is the manager of the largest bond fund in the world, he says that you have to pay the piper at some point and that it may lead to inflation. I believe that’s the case as well. I don’t know if it’s going to be inflation in 2013, but I do know that at some point, there will be increased inflation and that’s going to be a damper on some of the stock market. When you have slower growth and you’ve got inflation and when you have prices that have really seen a high rise in the last three to four years- that causes me to question whether or not that’s going to continue going forward.
Getting back to my philosophy, I do believe that there are different types of strategies—both sailing a little bit more passive and a little bit more active ones, more of rowing strategy–and having both of them may make sense in a portfolio for a client.
I’ll be talking with my clients in the next month or so to see what’s appropriate for them. I also think that having income strategies may make sense going forward and so I’ll be talking with my clients about that as well. If you’re going to take some risks, at least get some income as well. That’s one strategy and it may make sense with whatever the particular client might need going forward.
Those are my thoughts. I am going to expand upon them January 30, 2013, at 6 p.m. when I have a seminar here at my office. You’re always welcome to give me a call or an e-mail. Mike Brady, 303-747-6455.
I’m hoping that I’ve got all my notes here. I’m going to quickly look through here. It does look like it and the nice thing is I do videos throughout the entire year. If I’ve forgotten something here, I’ll just catch up with it on the next video.
You have a wonderful week and we’ll talk to you later.
Bye, bye now.
* “PE Ratio” is price to earnings ratio of a stock.