One of the interesting things in the past year is the very clear awareness that low oil prices are not all good, and that there is a negative aspect as well.
Same deal with interest rates.
While it’s nice to have low cost of borrowing, a negative interest rate could be deadly to many industries of our vibrant economy, and big parts of the stock market indexes.
While there have been some exciting one day swings in the unmanaged stock market indexes so far this year, it’s actually been relatively calm, without big 5% and 10% weekly and monthly swings that we see periodically in the markets.
As of the end of the 2nd quarter, most major unmanaged indexes were about break even.
In my video, I talk about the impact Greece and China may have on the markets going forward, and how the potential interest rate hike in September may affect things. I’m not gloom and doom, so if you’re looking for that, than you better watch something else!
Hi there. Mike Brady with Generosity Wealth Management, a comprehensive full service wealth management firm headquartered right here in Boulder Colorado. And I’m actually not in Boulder right now that’s why I’m a little bit more casual than usual. I usually have a library behind me, a blazer on, but for 4th of July weekend I thought I’d come up to our family cabin in Wyoming and with high speed satellite Internet, cell phones and computers and scanners, my entire office is right here as if I was right there in Boulder. Technology is wonderful. I hope you’re enjoying the summer. I’m enjoying, when I’m not working, the mornings and the evenings, the sunrise and sunsets are absolutely beautiful. I hope you’re having a wonderful summer as well.
So this is our second quarter review, sort of a year to date review and a rest of the year preview, kind of a mid year mid report, kind of a halftime check in here. We’re going to talk about Greece, we’re going to talk about China and interest-rate, but first let’s talk about what’s going on so far right now with the big picture. Big picture is so far this year the unmanaged indexes are about break even. They haven’t been really that volatile, although there have been some volatile days. But in general it’s actually in comparison to historical terms a relatively low volatility. I’m going to put up on the screen there the last 18 years of the unmanaged stock market index S&P 500. Why it started in ’97 I have no idea, but the chart starts there. And you’re going to see some big swings up and down and up and down. And since March 2009 you’re going to see that we’ve been on a very nice upward mobility on that particular index.
The stuff that’s happened in the last six months and the last 12 months, and although it’s taking a little bit of a breather, it’s a little bit of a consolidation period. I mean there’s times where the market goes up, it goes down and times when it goes sideways. And right now we’ve been going a little bit on the sideways. I’m going to put another chart up there and you’re going to see this is one of my favorite charts and frankly every video that I seem to do anymore I put this chart up because I like it so much. But this is since 1980, so that’s a good 35 years of the unmanaged stock market index S&P 500. The numbers on the top of that X axis are the end of the year returns. So 27 out of 35 years have actually been positive, some of them are negative, of course, but 27 out of 35 have been positive. But during the year that’s the number at the bottom that kind of that bar chart underneath the X axis and that’s the entry year decline. That means that just hypothetically if the market went up ten percent and then it lost four percent down to six percent and then went up and ended the year at eight percent, rebounded back, that would have and enter year decline of four percent because from the top to the bottom throughout that year there was the maximum four percent decline.
Well, that’s actually what we have so far this year. The S&P 500 is about to break even as of June 30th and it’s really kind of have been going up a couple percent, lose a couple percent, up a couple percent, lose a couple percent. And so that entry year decline is relatively minor and mild when you look at it in comparison to previous years of double digit highs to lows. So that’s been kind of the first six months of this year. One of the more difficult things to do as an investor is sometimes to do nothing. And so my video here today will sound an awful lot like some of my videos in the past over the last three/six/12 months because we’ve actually been on a little bit of a holding period now and it’s my analysis that that holding period is not leading till a big crevice that we’re going to fall into and Armageddon before us, but one that will actually creep higher that it is lower. Our earnings per-share for the market in general are coming in positive and I continue to think this is a good market to invest in, particularly in a well diversified portfolio.
I’m going to throw a chart up there and what you’re going to see here is this is another one of my charts that I used time and time again, but it’s rolling returns. That first grouping is one year, the second grouping is five, the third grouping is ten and the last one is 20. That’s a rolling return going all the way back to 1950. And that third bar in each one of those groupings is a mixture of 50 percent unmanaged stock market index with 50 percent of an unmanaged bond index kind of shoved together. And what you can see is that time is our friend. I mean historically going back 65 years, if you had those two indexes mixed together held like that there’s actually never been a five-year timeframe when you haven’t at least made a little bit on average each year. Some years it might be negative, negative, negative and then you made up for in the fourth year and the fifth year, et cetera, but when you average it out if you hold it for that timeframe there’s actually never been a timeframe, a rolling five-year holding period where you’ve lost money, and the same thing with ten year and 20 year. So we’ve got to be in this for the long-term I think as investors and so volatility in the market is a part of the game, even though we hated every time that it happens. And I think that this is one of those times when the headline is a little bit bigger than what we’re saying right now.
One thing that you’re going to hear an awful lot about in the next three months is interest rates. In September the Federal Reserve is going to get together and it is highly expected that they will start to increase the interest rate. And you’re going to hear all kinds of Armageddon stories about it. And all I can say is that we’ve been anticipating this for a very long time and I believe that it’s priced into the market. When we look at the last three interest rate increases, which was ’94 and ’95, ’99 and 2000 and then 2004 – 2006, initially there might have been a decline, I put that graph up on the screen, there might have been a decline but while the interest rates were increasing the unmanaged stock market index has continued to rise. And so it wasn’t this huge horrible thing that you might have been led to believe in the last two/three years while we’re looking at historical. Now of course, future this time it could be different. Maybe the interest rates increase and the market goes on the downside. I don’t think so. Possible. But the last three rate increases that hasn’t happened, I mean the market has continued to increase over a two-year timeframe even while the interest rates were increasing. So there’s not a perfect correlation that when interest rates increase then the stock market decreases. That’s just not true, even though you might have been led to believe that by some kind of watching something on TV.
Something that’s really big in the news right now is Greece. If I had to explain Greece I feel for all of the Greek people. They’re in a world of hurt and I’m not exactly sure where this is going, but it’s relatively small. They have an economy about the size of Detroit. They have an area, physically geographically the size of Louisiana. They’re really, really small but they are part of the European Monetary Union. And so therefore the question is how is that exit, you know, what’s the moral hazard if they get bailed out? Now I’m recording this on a Tuesday, they’ve already had their vote on Sunday and they’ve rejected by a pretty substantial amount, 61 percent, of negotiating and taking the first deal, well not really the first but the most recent deal that the European Union was giving them. So I feel for the Greek people. I have to tell you that it’s a little bit like having that family member who always has a big story about why they need money but no matter what they do, whether it’s a sibling or a child or a cousin, but they always spend more than what they bring in for whatever reason and their habits don’t change, their behavior doesn’t change so after a certain point you stop loaning them money. You stop giving them money. Everyone everybody in the family knows don’t give uncle Joe this money or don’t give Susie that. And so it’s a little bit like kind of that ugly sibling in the European Union right now, which is Grace. And there’s a few others that are looking to see what happens, Spain and Portugal, et cetera.
And I don’t want to minimize this in anyway because it could be a bigger deal than it is, although I don’t believe it is at this point, but it could. But when we look at history sometimes there are small events that turn out to be big events. I mean when Ferdinand was assassinated in 1914 it led to World War I. Well it wasn’t that small event of the assassination, it was all the alliances. There was a bigger picture than just that one small event. And so this could turn out to be the same thing, although I don’t believe that’s going to be the case at this point right now.
I think a bigger deal is China. I mean you’ve been hearing me for years now talk about China and how I don’t necessarily trust all of their numbers. Well, their stock market, which has just been on an absolute tear this year, just lost 30 percent of its value in the last three weeks. And so I think that those who were invested, that bubble there are also realizing that what is reported is not always the full information and so therefore it might have been priced in inappropriately before and now it’s being corrected. And so if that’s showing a slow down in the Chinese economy, that’s a huge economy, that’s something that could affect all of us. So I think that that’s something that we ought to watch as closely, if not more closely than Greece, even though Greece is a spectacular problem at this point right now.
That’s what I’ve got. I’m still optimistic going forward for the rest of the year and so I’m not making any major changes. We’re kind of in this holding period right now. There’s nothing that I’m seeing that leads me to change my beliefs from the last quarter or frankly the last year/year and a half that having a well balanced portfolio makes sense and that we’re not going to have, I don’t believe that we’re going to have this huge decline. And so I think we ought to just stay with where we are right now without any major panic. So anyway, like Brady Generosity Well Management, 303–747–6455. You have a great day. Give me a call. Give me an email. I’m always here. Thanks. Bye bye.
Somehow the $28,852,576.06 Man just doesn’t have the same ring to it, but that’s what it would be in 2014 with inflation.
Inflation is a real thing, even if it’s been incredibly low as of late. With quantitative easing and a zero interest rate policy by the Fed, it’s actually been unusually low and for a sustained time frame.
I think it’s reasonable to expect inflation in the future, whether that’s 2, 5, or 10 years.
There are some investments that are less interest rate and inflation sensitive than others, so keep that in mind when crafting a well diversified portfolio. If you have questions about your portfolio, I’m just a phone call away.
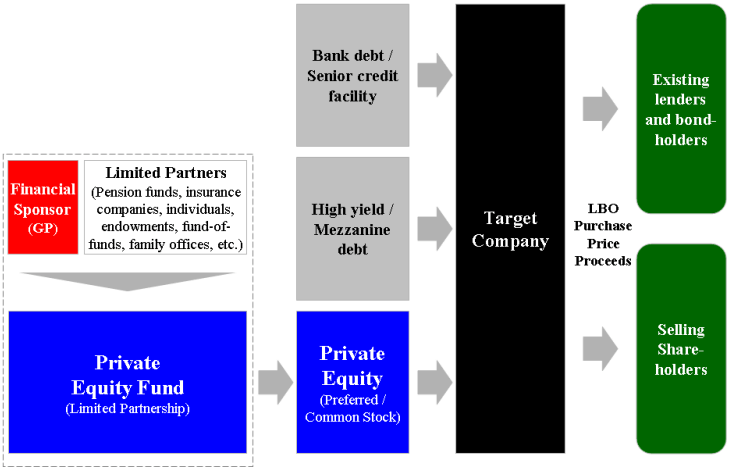
The acquisition of another company using a significant amount of borrowed money (bonds or loans) to meet the cost of acquisition. Often, the assets of the company being acquired are used as collateral for the loans in addition to the assets of the acquiring company. The purpose of leveraged buyouts is to allow companies to make large acquisitions without having to commit a lot of capital.
There is so much in the news right now, most of it about the impending debt ceiling crisis. Most of what you read, hear, and watch is sensationalized (in my opinion), so in this quarter’s video I basically dissect where we are right now, paying attention to the data points that I think are relevant.
Being the contrarian I am, I also address some common, assumed facts or assumptions that I simply don’t believe.
A longer than normal video, but let me conclude by saying I’m still optimistic, and not freaked out (unlike pundits on TV).
Click on my video to get my thoughts
Transcript:
Hi, there, clients and friends. Mike Brady here with Generosity Wealth Management, a comprehensive, full-service wealth management firm headquartered right here in Boulder, Colorado.
Today is going to be a little bit longer video than is normal. This is a third quarter review and fourth quarter preview.
We’ve got about two and a half months left. You’re hearing all kinds of news—on TV, radio and print. I want to kind of debunk some of the things that you’re going to be hearing about. Because this session is going to be long and a little more technical and I might go a little bit faster just because I have so much to cover. I’m going to give you all of my conclusions right up front.
If you want to turn my video off in the next 30 to 60 seconds, you can.
Right off the bat, I’m not freaked out as in one of those just about to go off to this huge cliff in a week or even two or three weeks due to anything that the Congress is doing.
There is a momentum that is being built up on the private sector with available cash that we are going to I believe from an investment point of view come through this fine. It is not unusual for us to have various conflicts—whether or not it’s an international conflict or whether or not it’s our own Congress and the President having a dispute. I am not freaked out.
I’m going to debunk here in today’s video something that you might hear from an investment point of view and then we’re going to try to prove that and that seems a lot but here’s my summary is that a rising yield could not necessarily mean that the market’s going to go down and the bond markets in particular.
The economy—if the economy goes down or slows due to anything that the Federal Government might do, that does not mean that our markets are going to go down. The economy does not equate to the market. You felt that the last three or four or five years, the unmanaged stock market indexes have done very well, but yet the economy has muddled through and that’s just one proof. I’m going to give a few other proofs of that as well.
P. E. ratios are not everything. Consumer confidence is pretty much meaningless I my opinion. Warren Buffet is not infallible. He’s out there talking about certain things and sometimes I disagree with him. I think he’s a brilliant individual, but it doesn’t mean that he’s God and that everything that he says we have to take as God’s word.
I do believe that the increase in the U. S. debt as it relates to as a percentage of our national GDP over the long term does provide a headwind that will dampen some of the opportunities that we have in the investing community.
That is something that I think long-term, but it doesn’t mean that it happens next week. Doesn’t mean it happens next month.
Time is your friend and that declines are normal. If you have been watching my videos and if you are one of my clients, hopefully that you have a portfolio of stocks, bonds and cash. Sometimes the stocks do well. Sometimes the bonds do well. They kind of mesh together. You might have some satellite holdings as well.
Stick true to what is the investment strategy for you so that you can sleep well at night. Understand that everything that you hear on TV and the news is not necessarily the truths and that in my opinion, the sky is not falling no matter what they want you all to believe.
If you want to turn off the video, that’s fine; but now we’re going to talk about it a little bit more in-depth with lots of facts to prove—I don’t know about prove—but to give some analysis to you about why I’ve come to the conclusion that I have. My clients expect me to give them straight answers. If I don’t know I tell them I don’t know.
The market has a tendency to go up, sometimes it goes down and sometimes it consolidates. Up, down, sideways. Those are the only three ways that it can go.
Up on the screen right now, you’re going to see it for the last 112 years. You’re going to see times when it has consolidated. You can see times when it has advanced and at times it has declined, but it has recovered.
Time is definitely in your favor as an investor. One thing you have to ask yourself is are you an investor or are you a speculator? Time is something that hopefully we all have, even if you’re going to retire next year. Even if you just retired or are in the middle of retirement. Hopefully, you’ve got a long life expectancy. So, not outliving your money is one of your goals; but also possibly grabbing income from it.
One thing as you look at that graph right there is you’re going to see the last 12 or 13 years. The question is that a consolidation or are we about to take off into one of those advances? Nobody knows 100% for sure, but I am more in the optimistic mode than I am in the “let’s jump off the ledge” and everything is going to be horrible.
Here it is over the last 13 years or so. You’re going to see up, down, up, down, etc. That last little bit is about March of 2009. I think we all know that friend, perhaps you were it and said oh my gosh, the market can’t continue to go up as it goes through the Dow went through 10,000, 11,000, 12,000, 13,000, 14,000, etc.
Sometimes it would go back down and that person would say, see I told you. I told you it was going to go down. Well, you know what, this is the same person who might have been in cash the entire time and this is the up and the down. Declines are a part of the market. As I mentioned, it goes up, down and sideways. You’ve got to be willing to take all three of those and you can’t expect for it always at all times to go just straight up.
The economy does not necessarily mean that the market will do the same thing and that they correlate and go in the same movement. If what happens with the debt ceiling slows down the economy in some way, which I don’t know that’s going to happen. There is certainly a lot of pundants out there who seem to know exactly what’s going to happen, either on the left hand or the right hand, what’s going to happen.
I don’t know. I just admit that, but here up on the sheet there, you’re going to see as an example of what I’ve just said, unmanaged stock market returns from various countries, Europe, Pacific, France and Germany and Brazil and Russia and you’re going to see that a lot of them are double digits. I’m going to tell you that Europe is very sick from an economy point of view.
This graph right there and that which I’ve circled, you’re going to see that in the last two or three years or so, we’ve had a declining year-over-year percentage return on the GDP for Europe as just one example. You’re going to see that on the right hand side that unemployment is in the double digits for Europe.
The economy does not necessarily mean that the market is going to go down if the economy goes down. It is definitely a headwind and I’d rather have it as a tailwind, something to help. If all other things—the amount of cash that’s in the economy—if other factors are pushing things so that the investments are going up, then the economy might be holding it down a little bit, but it doesn’t mean that perhaps there’s so much momentum on the investing side that it overcomes any other factors might have on it. It’s not just that oh, this is the negative. Wait a second. There are some positives as well.
The question is how does it net out? Some people might say the headwind from a bad economy or something that the government might do is going to negate all of the amount of cash that we’ve built up and all the balance sheets that are in corporations. The holding invasion is going on right now. I’m just not in that particular camp.
Another thing you can hear an awful lot about is the Fed. We have a new nominee. Her name is Yellen. They’re going to call her the dove because she will very likely keep a very loose monetary policy, meaning that there’s going to be lots of cash available for loaning and she’s very accommodating towards that. If the economy does have a tendency to slow down and muddle through, my guess would be that she’s going to maintain that low interest rate and maybe even increase some of those bond purchases. We’ll have to see, but I think our loose monetary policy is going to continue.
Interest rate yields have been increasing significantly in the last month. Here’s a graph here showing over the last 20 or 30 years or so, even longer than that, you can see that they’ve really gone down during that timeframe. Yet in the last two, three, four or five months, it has increased. However, just because the yield on the 10-year right now is around 2.64% or 2.65%, it’s not until it gets around 5% historically that has really caused a negative impact to the degree that while if it is continuing to increase, the market is going down.
You’ll see that on this graph right here. There’s a lot of number there. Essentially what you are seeing there is that dotted line right there in the middle is the 5% mark. As the interest rates continue to go up, the yield, the unmanaged stock market indexes went up as well.
Only once when it hit over 5% did it cause such a drag on the available capital for investment and for improvement that it started to hurt the U. S. stock market. We’re still far from that at 2.64, give or take. That’s what it is as of Thursday when I’m doing this video.
Another thing that I want to talk about is you’re going to hear about consumer confidence and that consumer confidence is up or is falling, etc.
I put no credence on consumer confidence. I’m putting that chart up there. You’re going to see that sometimes with consumer confidence that is low is when you would have liked to have invested 100%. Sometimes when it’s high, it’s a lagging indicator and people feel really good about things.
By the way, the University of Michigan only surveys 300 to 500 people on one day over the month. So it’s not a very big sample in my opinion and I put no…I don’t care. I don’t care about the consumer confidence and hopefully, you don’t care as well.
You’re going to see right here on this map graphically people are feeling good right now and it’s because we’ve had a little bit of a housing bump up in the last two or three years or so. That is one more proof that interest rates are probably going to remain very low because we have a housing recovery. People are feeling really good and they have a hard time seeing how they’re going to increase the rate from the Fed in a very short timeframe.
That and the fact that we have so much federal debt out there that we have to finance, we have to keep the rate at a very low rate. I do believe that’s probably going to stay low.
I do think that it’s very reasonable for companies to have accumulated corporate cash over the last two, three or four years. Right here on this next graph, you’re going to see deploying corporate cash at that very high level. Companies have been very rational in keeping their cash ready to invest when they sense. This is a good thing.
In cash return, the shareholders are also at a very high level. The amount of dividends that are paid out. There’s a lot of cash out there for those investors on the sidelines ready to jump in.
You’re going to hear a little bit about P. E. ratios and other things. Right now, I’m not concerned that it’s too low or too high.
I think it’s going to be just fine. This graph right up there. You’re going to see that when that dotted line from top to bottom there. Many times when it’s at this level, the returns for the stock market indexes have been positive. Sometimes they’ve been negative. You can see that. A large preponderance of them have been up on the top side. Only when it gets up to a 20 and 30 time does it really, really get way out of whack.
The next thing I want to talk about is that I do believe that Warren Buffet has been talking about the U. S. debt as a percentage of our GDP which is really our national income for the country not concerning to him.
Right now, it’s at about 102% or 104% and I do think that long-term, it provides a headwind against the investing and the ability of that particular country in order to move forward because it is, of course, sucking out the available capital to finance that particular tax.
You’re going to see here on this graph that I’ve just put up there that the U. S. is kind of on the right-hand side of that 100 mark. You’ll see that as you go down, Greece and Portugal and some other countries that are really an absolute mess as their debt got bigger and bigger and bigger. It’s not by the size, by the way. That’s what the yield is. The yield comes after some of the problems.
For right now, just really look at how the U. S. is on the right hand side of that vertical line, which is not the side that we really, really want to be on.
At this point, I do want to start summarizing which is time is your friend. On this graph right up there, you’re going to see is a depiction. The green is the range over the last 52 or 53 years of the unmanaged stock market index. It’s very high and very low.
Bonds, high and low.
Then we have a 50/50 mash of the two.
What you’ve seen is on an annualized basis, when you get out to five years, ten years and even twenty years, you have a normalizing return. You’re also seeing that they have a tendency and historically have been and that’s the only thing we have to go on. The future could be different, but historically what has happened is that those returns those people have been patient for five years, ten years and twenty years have had positive returns or even break even. There are not that may opportunities over a very long timeframe for there to be a decline.
One of the frustrating things is with this low interest rate environment, the options are very few I should say.
CDs and your money markets are hardly paying anything.
Bonds have a very low yield at this point. Unfortunately, many of us have been moved towards higher risks that we might not otherwise have taken.
Coming to a conclusion here, the last chart I want to show is right up there on the screen. It is the annual return. It is normal for there to be declines throughout the year. This year, believe it or not, has had from a top to a bottom, an unusually low top-to-bottom draw down. It has either been more up or sideways this year. Not a lot of huge decline on the down side.
It does not mean that when there’s a draw-down throughout the year that the year was all negative or that everything is just going to heck.
This graph is very important because we as investors who are in it for the long term who have hopefully created a portfolio that’s consistent with our risk levels and our objectives, etc. We have to understand that there will be some volatility in the market.
If you can’t handle that, we have to really seriously evaluate the strategy that you have. That is what I have here today.
Please give me a call if there are any concerns whatsoever. I can talk your ear off about some of my thoughts as we go forward and strategies that we should have or could have.
Mike Brady, Generosity Wealth Management, 303-747-6455.