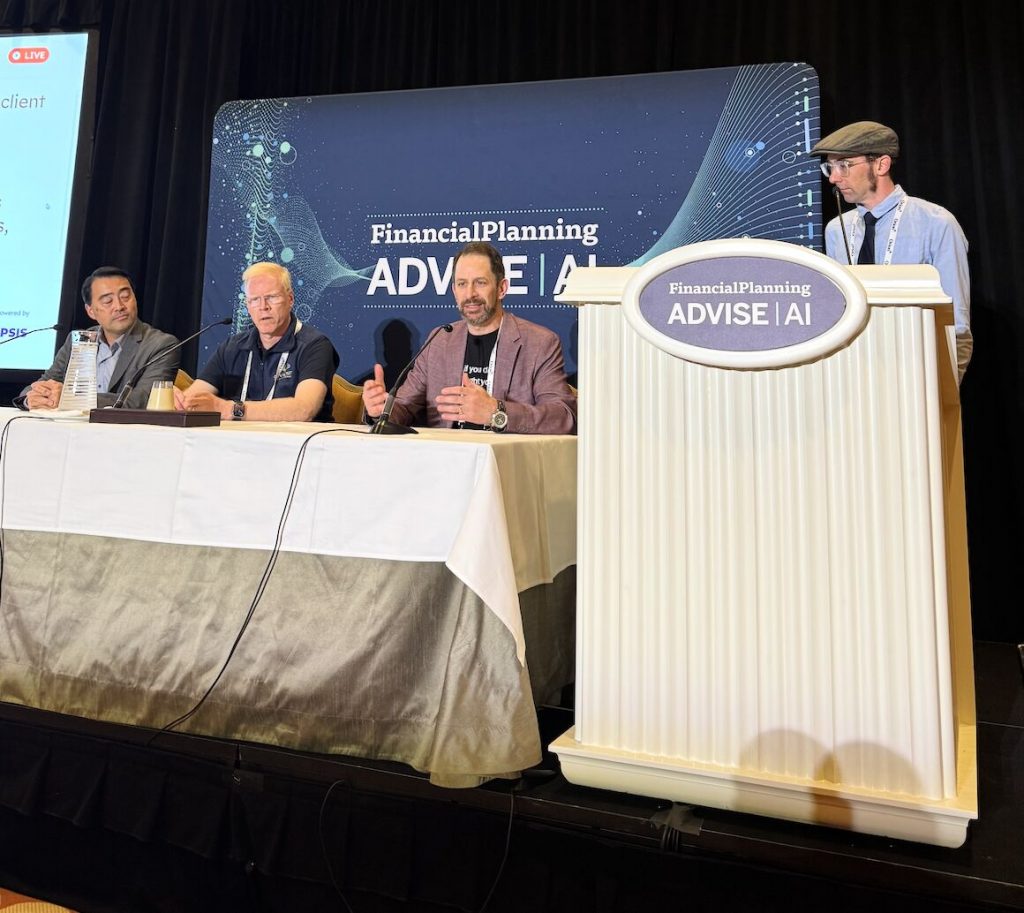
Generosity Wealth Management founder Michael Brady was recently invited to speak at the Financial Planning Advise AI Conference in Las Vegas, joining an esteemed panel of thought leaders to explore how technology is reshaping the advisor-client relationship.
In a session focused on practical AI applications in financial planning, Mike shared how he uses tools like Jump and FP Alpha—not to replace human relationships, but to enhance understanding and trust.
“I’d use this even if it didn’t save me time,” Michael told the audience. “As long as it deepens trust and catches what I miss.”
Mike discussed how AI note-takers and data-driven tools can help advisors stay fully present in client meetings, capturing nuances and emotional context that might otherwise be overlooked. By leveraging technology for administrative precision, advisors can focus more deeply on what truly matters—the client’s goals, emotions, and vision for their life.
“AI doesn’t replace empathy,” Michael explained. “It enhances it—allowing us to listen better, think clearer, and create more meaningful solutions.”
The discussion, moderated by industry experts and joined by Stephen Chien and Lawrence Sprung, CFP®, CEPA®, emphasized how the right use of AI can make financial advising more human—not less.
True financial confidence comes from perspective. This quarter offered a reminder that markets don’t move in straight lines—April’s turbulence made headlines, but as history has shown, recoveries follow setbacks. Michael Brady shares why he remains optimistic, how he helps clients focus on what they can control, and why aligning wealth with your deeper purpose will always matter more than short-term noise.
Hi there. Mike Brady with Generosity Wealth Management, a comprehensive full-service financial services firm headquartered here in Boulder, Colorado. It is the end of the quarter. It has been basically a pretty darn good year except for one month, which was April, which of course got all the headlines. Lots of stuff happened in April, and at this point in time, with the returns for the unmanaged stock market indexes where they are, historically 75% of the time the year ends positive. But you know what, there’s a lot of time left. We’ve got October, November, and December. But I’m feeling very good and very optimistic.
It is important for us to remember the long-term view. The reason why I bring that up is, look at this chart up on the screen, and I’ve just circled what happened in April. When you look at that, that’s multiple years. I know those things are going to happen. But the reason why we have equities, the reason why we have investments long term, is because times like I’ve just circled historically always recover.
I remember back in April, a client emailed me because they were watching the news, and it was all about the tariffs and a catastrophe—the doom scrolling. If you’re looking for negative news, you’re going to find it everywhere you look. It was like, why do I have equities? Remind me again why we have equities? The reason we have them is because of the nice recovery. It was negative 19 on an unmanaged stock market index like the S&P 500 for the year. It is now in the double digits for the S&P. 14% positive for the year. Quite the reversal and overreaction, which I said at the time and which I believe has been proven out.
The market will go up, it will go down. That is the one given that I’m going to express out in the world. If you are looking for negative things, I feel that there are a lot of advisors, a lot of TV pundits who do a lot of fearmongering, a lot of fear-based selling or advice, and that’s never my approach. I believe that every problem has a solution. When a client comes in to see me, I want you always to leave with some hope and optimism, because frankly, for the negativity—and if you’re looking for negativity, you’re going to find it—my job is to find the positive solution in every situation.
When it comes to working with me from a wealth management point of view, it is finding where you want to go, what’s your why, what’s your purpose, what’s your financial goal that we’re trying to get to, and how are we going to get all the balls that are in the air, which is your life? Things that have happened in the past, things that are happening right now in the present, and things that you want to have happen in the future—how can they all be put down into an equation so we can be diligent and proactive about the particular variables in that equation? The equation’s answer is what you want, which is the desired outcome. That’s it.
It’s not all investment related, and it’s not about worrying too much about things that you may not have control over. Let’s have control over the things that we do have control over, which is understanding the aspects of our lives, where we are presently, where we want to go, and how they fit in. Investments are a part of that, but it is only one part.
That’s why I call myself a wealth manager, not an investment advisor. I care about increasing your wealth and helping guide you like a coach, but you get to be the hero. The success and the failure is yours. We are now nine months into the year, and I’m feeling very good about the next three months. But you know what, our time horizon is not three months, so what’s most important is that we have the right duration for you, that you and I communicate very well if you are my client.
If you are not my client, consider being my client.
If you’re one of my clients, please, I am bringing on new clients. I have an infrastructure that supports me meeting with good people that you feel I could help out, like I have helped you out. I will treat them like kings and queens, and I will really do what I can to understand where they want to go and help guide them through the full-service financial services firm that I have, which is Generosity Wealth Management. We align wealth with purpose and possibility, and that possibility is what may or may not even be in your mind right now. That’s something we can explore together. Michael Brady, Generosity Wealth Management, 303-747-6455.
Have a wonderful fall, and I will talk with you at next month’s newsletter as the year continues to unfold. Thank you.
In this quarter’s video, Mike Brady—founder of Generosity Wealth Management and the Generosity Group—steps away from the noise and into the quiet of Wyoming to share something deeper than market headlines. Drawing from 34 years and over 15,000 trading days of experience, Mike offers timely insights on what it takes to succeed in today’s financial world: humility, emotional discipline, objectivity, and a clear sense of purpose.
Whether you’re new to working with us or have been with us for years, this update is a reminder that true financial success isn’t about predicting the market—it’s about preparing for what matters most to you.
Watch the video now to hear Mike’s reflections and the mindset that continues to guide our clients through uncertainty, opportunity, and lasting legacy.
Transcript
Hello, I’m Mike Brady with Generosity Wealth Management, a comprehensive, full-service financial services firm headquartered in Boulder, Colorado, though I’m recording this from my place in Wyoming. I believe strongly in stepping out of your routine to think and brainstorm, and being up here in Wyoming gives me plenty of opportunity for that. This is the year-to-date video for the end of the second quarter.
First, I’d like to extend a warm welcome to all our new clients who’ve joined us in the last two or three months. I recently integrated another professional’s clients into my business and have enjoyed meeting many of you. You’re the kind of clients I love working with, and I’m thrilled to have you on board. Generosity Wealth Management is growing, and I’m excited about the future. I’ve been in this industry for 34 years, with Generosity Wealth Management established for 18 of those, and we’re building a legacy that will outlast me and others. We’re always looking for new clients, so if you’ve had a positive experience with us, please consider referring others who might benefit from our services, especially business owners looking to sell their business in the next three to five years. That’s my specialty—helping maximize value and manage the impact on personal wealth.
You can learn more about our work at generosity-group.com, the company I founded to align wealth with purpose and possibility. We do this through three key areas: Generosity Wealth Management, offering comprehensive financial services; Generosity Estate Planning, ensuring dignity and control over your assets and medical decisions during your lifetime and beyond; and Generosity Business Exit Planning, tailored for business owners preparing for a sale. Please visit the website to explore these services further. Additionally, I’m part of Ed Slott’s Elite Advisors Group because, outside of your home, your retirement account is often your biggest asset, and taxes are typically your largest expense. Being an expert in both is critical to serving you effectively.
Now, let’s reflect on the last quarter and year-to-date lessons. If you’re looking for a highly technical market analysis, this isn’t the place—you can find that on CNBC, Fox Business News, or other financial websites. My focus here is on the broader lessons. The first is humility. No one can predict the future with certainty. Three months ago, many were confident in their forecasts, yet April was a tough month, followed by a recovery in June that few anticipated. Over my 34 years and 15,000 trading days since 1991, I’ve learned the market always surprises. History may not repeat, but it rhymes, and humility is essential when approaching an inherently uncertain future.
Another key lesson is objectivity. Personal biases—whether political or otherwise—can cloud your judgment. If you lean strongly one way politically, you might gravitate toward news or people that reinforce your views, leading to confirmation bias. I proactively avoid this by seeking diverse perspectives, as I shared in last month’s newsletter with resources like allsides.com and groundnews.com. These platforms present the same story from left, right, and center viewpoints, helping me form my own conclusions.
Discipline and emotional control are also critical. Every year brings trepidation—whether it’s a politician you dislike, a global conflict, market fads, or significant declines. Volatility is normal; most years see at least a 10% drop in unmanaged stock market indexes. My videos consistently highlight that three out of four years are positive, but declines are part of the journey. Emotional discipline ensures a more enjoyable financial path. Money is meant to help you relax and achieve your goals, so your investments must align with your time horizon. Funds needed in the next month or two shouldn’t be in the market, while those for five, ten, or twenty years can weather volatility. Knowing your personal goals and maintaining discipline is key.
We could dive into tactical details about the past or upcoming quarters, but without the foundation of discipline, emotional control, and a clear time horizon, those details are secondary. Focus on the right questions to maximize your chances of achieving your goals.
That’s it for this quarter. I’ll be back with another video next month. If you have questions or concerns, reach out to me at 303-747-6455 or via email, which is displayed on the screen. I hope you’re having a wonderful summer. Bye-bye.
In this month’s video message, Mike Brady, founder of Generosity Wealth Management, reflects on his 34 years in the financial industry—an impressive span covering more than 15,000 trading days. Drawing from this wealth of experience, Mike shares four guiding principles that have remained constant through every market cycle: define your goals, understand your time horizon, practice discipline, and manage your emotions.
As he discusses current market trends and the normalization he’s seeing, Mike emphasizes the importance of avoiding emotional reactions to short-term events. Instead, he encourages viewers to stay focused on long-term goals and to approach their financial lives with clarity and calm.
This video is both a market update and a mindset check—a reminder that true financial success is less about reacting and more about steady, purposeful planning.
Transcript
Mike Brady with Generosity Wealth Management, a comprehensive full-service financial services firm headquartered in Boulder, Colorado. It is May 2025, Spring. You can certainly feel it outside. Hopefully, you’ve spent a lot of time in this beautiful sun if you’re here in Colorado if you’re outside of Colorado. Hopefully, it’s wonderful in spring weather, wherever you are.
So, I want to talk a little bit about current market conditions, but before that, I want to provide the context. I want to tell a story about my experience kind of. And I’ve been doing this for, you know, meeting with clients for 34 years now. I happened to put it into the computer because I was curious the other day, how many trading days, you know, market days that has been. And that’s been 15,000 out days, 15,000 trading days since I started in August 1991.
That is 55,000, almost 56,000 trading hours, which is unbelievable. And I share that with you because I was meeting with someone a month or two ago, and they said, “Mike, you’re completely calm. I joked with them that I have ice for blood. And that’s because I have seen an awful lot. In my 34 years of working with clients in differing environments, I can sit here and point out how it’s different this year and how there’s something to be concerned about. If you’re optimistic, there’s something to be optimistic about. If you’re negative or pessimistic, there’s always something to be pessimistic about. And I go with the flow. It leads me to some of my Mike Brady truisms as I see it, which is how do you be successful as it relates to your life and to your investments and to your whole financial future. And I’m going to give you some of my thoughts here.
The first one is to clearly define what you’re going towards. What is your financial goal? What is your life goal? Because before we talk about how to point the boat in the right direction, we gotta know where and what that direction is. Before we row the boat, we have to know where we were going. And being clear about what your goals are, and it is okay to have multiple goals. One of them might be to retire at a certain age or to not outlive your money or pass money to your kids or to your heirs. Another could be to save for your child’s education or grandchild’s education. Each of those have different time frames, which kind of boils down to my second thing.
One is clearly defining your financial goals, and the second is know what the duration or the time horizon is, because that starts to inform how you reach those goals. If you need money next week, that’s considerably different than if you need money 20 or 30 years from now. And both environments are different in how we approach them.
The third thing is discipline, okay? Whether that is, “I want to be disciplined in my income and expenses”, “I want to be disciplined in how I save for retirement”, or “I want to be disciplined in how I withdraw money or saving for retirement. Being in the contribution phase is completely different than being in the withdrawal phase. So whichever way it is, it’s being disciplined in what it is that you are, whatever phase of life that you’re in, treating your life like a business.
The fourth thing that I’ve found is very helpful for someone to be successful is to have control over your emotions. We’re not a bunch of, you know, Star Trek Vulcans with pure logic. We have emotions, but what we don’t do is we don’t let those emotions impact the decisions that we’re making–we (don’t) react emotionally. And I have to tell you, this is where I get very cynical. If you’ve talked with me about your news sources, you have to think about the news sources that you’re consuming, whether that’s reading, listening, or watching TV, whether they are helping you or hurting you. Maybe too much for today’s video, but I have a healthy skepticism because they’re not there to inform you most of the time. They’re there to excite your emotions–many of them. I get my news from various sources, and I read almost entirely. And I can tell even if the reading, if it’s trying to get me all excited and getting, you know, kind of throwing red meat to people who think already like that. Red meat to dogs or to the animals to get everyone all excited–or is it dispassionate? Well, “these are the pros–these are the cons”. I can kind of see this and that. Or is it really trying to persuade you and get you all excited so that you’ll go and do, maybe vote one way or the other or support one thing over another. Be very mindful of that.
I’m going to put somewhere in the newsletter where I get some news sources that I get it from–allsides.com, ground news. These are places that have maybe the same article from the left, the right and the center. So I can sort of see what the truth might be. Optimistic, pessimistic and right down the middle, you know, something that might be a little bit lighter but something that’s more technical. I read an awful lot of economic journals as well and technical analysis so that I can see the actual data, not somebody else’s interpretation of what that data is.
I’m going to pivot here. Now what we’re seeing in the market is kind of a normalization as I see. If you go back to my last couple of videos, my last couple of newsletters, I’ve said you don’t make long term decisions based on short term events. So what someone who is prone to be pessimistic might say is like, “well this short term event is different this time or this is just leading to a long term event, and so this is an early predictor”. My answer would be “maybe, but we don’t know the future”. You’ve got to have some humility. The future is inherently unknown. So what has happened over the last couple of months has been an overreaction in my opinion. When anybody starts talking to me, especially a TV pundit that, “it’s so obvious that we’re going to have a recession in three months, six months, nine months”, I discount it right off the bat.
Nothing is obvious in this world. You always have to look at data, what’s the data telling you? How does this play out in an incredibly complex system which is the world economy, which is also reflected in the stock market. Not only is the stock market filled with a bunch of data of future earnings and past earnings, but it’s also human beings with their expectations and their own biases coming into it. So, I always tell people–let’s take things with a grain of salt, let’s not get too bent out of shape because what I have seen over the years plays out time and time again. I think they say that history doesn’t repeat itself, but it does rhyme.
We’ve seen certain events in the past, but you know, sometimes it’s very similar, but it’s never the same. Whenever we go into a kind of a military conflict, you’ve always got people “is this the next Vietnam?” or “when are we going to get into a quagmire?” You almost have to wait for that to play out again. And you know, the generals are always fighting the last war.
Whenever there’s bad things that happen in the market, and they will always happen, they have always happened, they’re always trying to explain it by what we saw the last time. And so what I’m here to say is that we have seen this time and time again, multiple data points. I’ve seen it my 34 years, my 15,000 trading days.
One thing that I have seen is that a well diversified portfolio has come back. It has sometimes taken months and quarters. In this case, it certainly does look like it has been incredibly short time. If it continues the way it’s doing when I’m writing this video, it has been incredibly short amount of time for there to be, for to be a recovery.
The bad time in the last three, four years has actually been 2022. That was a reaction to, as I see it, the Inflation Reduction Act and lots of money flowing in at the wrong time. Other interest rate missteps. But we have seen some poor communication, some missteps so far this year of which we have recovered very nicely. And I hope that will continue throughout the year. If it doesn’t, then we will continue to have the discipline, we will keep our duration in mind, and we will keep our emotions in check as we reach our financial goals for you.
303-747-6455 Michael Brady.
One of the reasons why I don’t talk real technical investment analysis is I like to talk about that individualized with specific clients. But I also believe that if you get some of the four that I’ve just talked about, you get those under your belt, that part figured out, the investments — they just support that. They’re almost the least important variable towards reaching your financial goals. If you have the discipline plan, the duration, the financial goal defined and your emotions in check, everything else is good to go.
Mike Brady, 303-747-6455.
You have a great rest of the month. Great June. We’ll talk to you later.
Market ups and downs are inevitable, but how we react to them makes all the difference. In this video, Mike Brady of Generosity Wealth Management explores the importance of having a plan in place before volatility strikes. From understanding emotional influences to maintaining a long-term perspective, this discussion highlights key strategies to help investors remain calm and focused.
Transcript
Hi there. Mike Brady with Generosity Wealth Management, a comprehensive full-service financial services firm headquartered in Boulder with an office in Denver as well.
I’ve been with my wife for 31 years, and before we got married, someone suggested, “Hey, you really ought to go to marriage counseling or pre-marriage counseling.” The goal was not due to any issues we had, but rather to discuss, “How are we going to handle disagreements or miscommunication moving forward?” So we set ground rules for how we might overcome the speed bumps that are inevitable in any marriage. I’ve got to tell you, 28 years later, I’m still married and very happily married to my wife, Cassidy.
I bring that up because investing is no different. Before you invest, there’s certain things that you have to answer for yourself.
• How am I going to emotionally react?
• How am I going to push to the side the outside influences that want to excite my emotions?
• What about the duration?
• What am I going to do in bad times, because they are inevitable? As a matter of fact, the one certainty is that there will be ups and downs in the market.
So, therefore, how am I going to invest, not trade?
• How am I going to invest for the long term, knowing myself?
• How am I going to keep control of my emotions?
• How am I going to keep the duration, meaning the time horizon, with my goals so that I can have the desired outcome that I want?
You do that before something happens, any turbulent water like we’ve seen in the past few weeks.
I want to talk about that. One thing that I am always very sensitive to, and I admit it, is humility and the fact that the future is inherently unknown. One thing that you will not get from the TV or from reading any columns in the newspaper is a sense of, “Hey, I think this might happen, but I might be wrong.” You never hear that. It’s usually a very certain statement about what will happen.
What’s mildly irritating to me is that many of those pundits have not been held accountable for the previous times that they’ve been wrong. You can sit here and go through almost any pundit and say, “You were wrong here, you were wrong there, you thought this recession was going to happen, and it didn’t,” etc. They’re not always held to their conviction like those of us who actually do it for a living. That’s usually a little irritating to a guy like me.
One certain thing is that the market hates uncertainty. That’s just the nature of it. And I think that’s really what we’ve seen in the last two, three, four weeks. We’ve had some uncertainty. We’ve had some quite strong proclamations, and then maybe back down, and then said again and again and this and that. That just creates some uncertainty.
I’m not here in today’s video to say whether one is right or wrong or what the policy ought to be. Those of us here at Generosity Wealth Management care about how that impacts the portfolios that you have, and the reason you have those portfolios is to help you reach your financial goals.
So we think about that, we talk about it. We, in good times and bad times, try to create the best portfolio so that in either of those times, you’re able to go through it without too much stress.
Up on the screen, I’ve shown and I’ve circled the intra year. It is normal for every year for there to be declines from a top to a bottom within the year. And this has happened the last two, three, four years like it has for the last 45 years that you see on that screen. It is normal for there to be declines during the year.
Is this the beginning of a decline that will continue through March and April and May and June? No one knows. Anyone who says that they absolutely know that is lying to you because the future is inherently unknown.
You’ll see that three out of four years are positive even though the average decline since 1980 is over 14.1% within the year. That doesn’t mean that it ends negatively. It means that almost every year, there are declines, usually double digits. However, three out of four years are positive. I will tell you that my experience has been that three out of four is kind of a magic number. It seems like three out of four quarters are positive. Three out of four years are positive as well. So it’s both three out of four quarters, three out of four years. That’s just kind of the way it has gone, in my experience.
I want to show another chart up there–chart number 2.
Believe it or not, my experience is 34 years, so I’m actually older than this chart, which really makes me feel old. And I’ve been through this entire thing. We are right there. I’ve just circled where you are. And during that entire time from the left to the right, I’ve always heard, “Well, it’s different this time. Well, we’ve never had this before”.
I’ve heard naysaying my entire career that I’ve had for 34 years and I hear it now. I have ice for blood. That’s just the way it works, is that I’ve seen so much that those who the most successful are the people who are patient and the people who have their emotions in check. Doesn’t mean that you’re some kind of a Spock, some non- emotional being. But you can acknowledge emotions, but then not necessarily either act or let it control you.
I remember hearing something on the History channel that a soldier in a war-time setting is not someone who has no fear. If that’s the case, they might be a psychopath. It is human for you to have fear. The question of bravery is when you overcome that fear and do what needs to happen anyway.
This next chart here, three columns on the left-hand side. One year you can see 100% stock market index from 1950, it’s that green chart, the blue is the bond. It’s a huge range. If you look at each year from 1950 till last year, the big range, the best was +33, the worst was -13. When you squish them together, 50% bond index and 50% unmanaged stock index, you can see the range for one year.
But as you go from the left to the right, this is the reason why I’ve got that chart up on the screen, you’ll see that if you have a balanced portfolio of 50% unmanaged bond index and 50% stock index, there actually has never been a five-year time horizon going back 74 years where you haven’t at least broken even, made a little bit of money.
That doesn’t mean that on an annual basis, which is those first three bars we just went over, it could be volatile. My advice is if you go back to the videos that I’ve done for years, for well over a decade, you keep calm, you keep the duration in mind.
One of the most important things is your time horizon, and the more aggressive you are, each year you have more volatility. But my experience has been, and the recommendations that I have for people is that you will probably be happier over a 5, 10, and 20-year time horizon.
By the way, in that chart on the far right-hand side is the 10-year and the 20-year rolling averages. And you’ll see that remaining invested for a 5, 10, and 20-year time horizon is in your best interest. If you’re in your 60s and 70s, you might say, hey, I’m not going to live that long—I’m now retired. The answer is you got to stick with what you have that allows you to stay with your plan. Hopefully, you’ll have many 5 and 10-year time horizons left.
You know, one thing I’d like to point out on this next graph is what I just circled there at the bottom. When consumer sentiment / investor sentiment is at its lowest, you can see what happened in the summer of 2022, a very bad time. The next year, the unmanaged stock market index did +17%. How everybody feels about it, the sentiment, is not necessarily correlated to what is actually going to happen.
That’s why I talk about humility. When anyone tells me, “Well, this is obvious–this is going to happen this way.” Frankly, I discount you right off the bat. I will never talk with you that way in our interactions.
The last chart I have on the screen is the Fed and interest rates. I’ve just circled where we are right now, and this is a good thing. Interest rates coming down is a great thing for our mortgage rates, and for getting loans unstuck in the business environment. Lower rates is a good thing for fluidity in the markets.
So it is not all negative, as you might see in whatever news program–whether it’s from the left, the right, the center, — if it bleeds it leads. Not everything is negative. It is never black or white. If you feel that way, I’m just going to fundamentally disagree with you.
In my career, things have always been grey. It sometimes goes to the left and it sometimes goes right. Sorry, not politically left or right. I’m talking about life takes path A or path B, that’s just the way it works. What we have seen is in all different types of situations, including different precedents, with different styles, with different things happening in the world, that the market has over time always done better.
I don’t know the future any more than you do. But what we do is we have a plan in place beforehand, not during it, but beforehand, and then you just relax during it.
I have to tell you that some of the years that have been really difficult, like 2022 was a very difficult year. We had a lot going on then. Unmanaged bond indexes and unmanaged stock indexes– both of them down for the year double-digits. At the end of the year, some clients fretted the entire year whereas some clients were cool as cucumbers. They both ended with the same rate of return. The question is, which one do you want to do as you’re looking at how you’re interacting with your particular portfolio?
I do not recommend, those of us here at Generosity Wealth Management, do not recommend any changes just because the market has done one of its intra-year declines. It might be the beginning of a decline that might go for another quarter or two. That’s absolutely possible. But that’s why we don’t invest for one quarter, three quarters, even one year. That’s why we are invested for multiple years. If your time horizon is less than a couple of years, you should not have money in the market anyway. That’s one of the fundamental rules in investing.
Generosity Wealth Management. Annie and me Mike Brady, are always available at your service, to talk with you through this at any time.
303-747-6455. You have a wonderful day. Thank you. Bye.
Financial markets are unpredictable, but your strategy doesn’t have to be. In this post, Mike Brady discusses the importance of long-term fundamentals, managing emotions, and staying disciplined in your financial journey. Plus, we’re excited to share how Generosity Wealth Management is evolving with a refreshed mission, vision, and values—discover what it means for you!
Transcript
Hi there. I’m Mike Brady with Generosity Wealth Management, a comprehensive full-service financial services firm headquartered in Boulder but with an office in Fort Collins as well.
Today, I want to talk about a couple of things. The first one is about the fundamentals. You know, I repeat some of the same things over and over again. And I’m reminded of that Buddhist saying, “Before enlightenment, chop wood, carry water. After enlightenment, it’s chop wood, carry water.” The same things. Your perspective might change, but the fundamentals remain the same.
I bring that up because I’m recording this on a Sunday when there are some tariff discussions between the United States, Mexico, and Canada, and I have no idea how it will play out. That’s why it’s important for us to go back to what we believe, which is the importance of having a long-term time horizon, being disciplined with our emotions, being confident in our plan, and having a long-term time horizon.
You know, the one thing I’m going to guarantee going forward is that the market will go up and it will go down. But of course, we have investments because we believe that it will be two steps forward, maybe one step back. But we’re not going to have the two steps forward if we’re so worried about the one step back. That’s just the way it works. And as a matter of fact, we try to go four steps forward and one step back. Okay, so we’re really making great progress, given time with the ups and the downs.
Another guarantee is around volatility. Sometimes, there’s lots of volatility in the markets. That’s just a given. It has always happened and always will be going forward. And sometimes there’s very little. I remember in 2017, there was such a consensus amongst all the pundits that we will have lots of volatility. And frankly, 2017 was one of the least volatile years in the unmanaged stock market indexes. I will tell you, in the last couple of weeks, we haven’t had much volatility, frankly, you know, not like, 4 or 5% or so in the unmanaged stock market indexes. So let’s have a sense of humility as well.
It is normal for a year to see declines. And if that’s going to happen sometime this year, and odds are that it will, I don’t know if it’s going to happen next week. I don’t know if it will happen next month, six months, eight months from now. There usually are those steps backward. It’s going to happen. That’s why we don’t have invested in the markets, money that we need for our use or need to convert into cash for our uses. The duration, the time horizon, when you’re going to need the money is very, very important. So let’s keep that in mind. Let’s keep the fundamentals. Okay?
Before the election, before the inauguration, we chopped wood and carried water and we’re going to chop wood and carry water once again.
Second thing I’d like to talk about is I’m going to have a kind of a series over the next, I don’t know, number of videos over the next year or two. I’m just going to drop them in here and there, sharing with you the mission, vision, and values of the work that I’ve done with my firm.
My firm, of course, is your firm. You are vested in my success and the way that I deliver and interact with you. And one of my taglines is:
Where wealth aligns with purpose and possibility.
What that means is that wealth aligns with purpose. That’s the present with what we want it to do. We want to live our lives now, whether that’s give money away, whether that’s take a trip to Europe, put your kids through school, or make your monthly mortgage payments. Purpose is the purpose of your money, but also your retirement.
Or the possibility. What is possible in the future? A great retirement. What are your dreams? Your retirement, put your kids through school, perhaps pay for your children’s weddings in the future, the down payment on their house, pass on to the next generation. You get to make the dreams and the possibilities.
What I do is say this is where we are, this is where we want to go, and what’s the gap between the two? We’ve got the purpose; we got the possibility. Let’s get that wealth to align. And that’s what I wanted to talk about today.
In the newsletter, I will link this video to the full mission, vision, and values that my team and I worked on. My colleagues, my partner, and the rest of my team on the mission, vision, and values for Generosity Wealth Management. I’m very proud of it, and I want to share it with you in the coming months.
In the meantime, if you have any questions or concerns, give me a call or an email. Of course, keep your emotions in check. But if you can’t do that, give me a call because that’s what I’m here for: 303-747-6455. Thanks.