While there have been some exciting one day swings in the unmanaged stock market indexes so far this year, it’s actually been relatively calm, without big 5% and 10% weekly and monthly swings that we see periodically in the markets.
As of the end of the 2nd quarter, most major unmanaged indexes were about break even.
In my video, I talk about the impact Greece and China may have on the markets going forward, and how the potential interest rate hike in September may affect things. I’m not gloom and doom, so if you’re looking for that, than you better watch something else!
Hi there. Mike Brady with Generosity Wealth Management, a comprehensive full service wealth management firm headquartered right here in Boulder Colorado. And I’m actually not in Boulder right now that’s why I’m a little bit more casual than usual. I usually have a library behind me, a blazer on, but for 4th of July weekend I thought I’d come up to our family cabin in Wyoming and with high speed satellite Internet, cell phones and computers and scanners, my entire office is right here as if I was right there in Boulder. Technology is wonderful. I hope you’re enjoying the summer. I’m enjoying, when I’m not working, the mornings and the evenings, the sunrise and sunsets are absolutely beautiful. I hope you’re having a wonderful summer as well.
So this is our second quarter review, sort of a year to date review and a rest of the year preview, kind of a mid year mid report, kind of a halftime check in here. We’re going to talk about Greece, we’re going to talk about China and interest-rate, but first let’s talk about what’s going on so far right now with the big picture. Big picture is so far this year the unmanaged indexes are about break even. They haven’t been really that volatile, although there have been some volatile days. But in general it’s actually in comparison to historical terms a relatively low volatility. I’m going to put up on the screen there the last 18 years of the unmanaged stock market index S&P 500. Why it started in ’97 I have no idea, but the chart starts there. And you’re going to see some big swings up and down and up and down. And since March 2009 you’re going to see that we’ve been on a very nice upward mobility on that particular index.
The stuff that’s happened in the last six months and the last 12 months, and although it’s taking a little bit of a breather, it’s a little bit of a consolidation period. I mean there’s times where the market goes up, it goes down and times when it goes sideways. And right now we’ve been going a little bit on the sideways. I’m going to put another chart up there and you’re going to see this is one of my favorite charts and frankly every video that I seem to do anymore I put this chart up because I like it so much. But this is since 1980, so that’s a good 35 years of the unmanaged stock market index S&P 500. The numbers on the top of that X axis are the end of the year returns. So 27 out of 35 years have actually been positive, some of them are negative, of course, but 27 out of 35 have been positive. But during the year that’s the number at the bottom that kind of that bar chart underneath the X axis and that’s the entry year decline. That means that just hypothetically if the market went up ten percent and then it lost four percent down to six percent and then went up and ended the year at eight percent, rebounded back, that would have and enter year decline of four percent because from the top to the bottom throughout that year there was the maximum four percent decline.
Well, that’s actually what we have so far this year. The S&P 500 is about to break even as of June 30th and it’s really kind of have been going up a couple percent, lose a couple percent, up a couple percent, lose a couple percent. And so that entry year decline is relatively minor and mild when you look at it in comparison to previous years of double digit highs to lows. So that’s been kind of the first six months of this year. One of the more difficult things to do as an investor is sometimes to do nothing. And so my video here today will sound an awful lot like some of my videos in the past over the last three/six/12 months because we’ve actually been on a little bit of a holding period now and it’s my analysis that that holding period is not leading till a big crevice that we’re going to fall into and Armageddon before us, but one that will actually creep higher that it is lower. Our earnings per-share for the market in general are coming in positive and I continue to think this is a good market to invest in, particularly in a well diversified portfolio.
I’m going to throw a chart up there and what you’re going to see here is this is another one of my charts that I used time and time again, but it’s rolling returns. That first grouping is one year, the second grouping is five, the third grouping is ten and the last one is 20. That’s a rolling return going all the way back to 1950. And that third bar in each one of those groupings is a mixture of 50 percent unmanaged stock market index with 50 percent of an unmanaged bond index kind of shoved together. And what you can see is that time is our friend. I mean historically going back 65 years, if you had those two indexes mixed together held like that there’s actually never been a five-year timeframe when you haven’t at least made a little bit on average each year. Some years it might be negative, negative, negative and then you made up for in the fourth year and the fifth year, et cetera, but when you average it out if you hold it for that timeframe there’s actually never been a timeframe, a rolling five-year holding period where you’ve lost money, and the same thing with ten year and 20 year. So we’ve got to be in this for the long-term I think as investors and so volatility in the market is a part of the game, even though we hated every time that it happens. And I think that this is one of those times when the headline is a little bit bigger than what we’re saying right now.
One thing that you’re going to hear an awful lot about in the next three months is interest rates. In September the Federal Reserve is going to get together and it is highly expected that they will start to increase the interest rate. And you’re going to hear all kinds of Armageddon stories about it. And all I can say is that we’ve been anticipating this for a very long time and I believe that it’s priced into the market. When we look at the last three interest rate increases, which was ’94 and ’95, ’99 and 2000 and then 2004 – 2006, initially there might have been a decline, I put that graph up on the screen, there might have been a decline but while the interest rates were increasing the unmanaged stock market index has continued to rise. And so it wasn’t this huge horrible thing that you might have been led to believe in the last two/three years while we’re looking at historical. Now of course, future this time it could be different. Maybe the interest rates increase and the market goes on the downside. I don’t think so. Possible. But the last three rate increases that hasn’t happened, I mean the market has continued to increase over a two-year timeframe even while the interest rates were increasing. So there’s not a perfect correlation that when interest rates increase then the stock market decreases. That’s just not true, even though you might have been led to believe that by some kind of watching something on TV.
Something that’s really big in the news right now is Greece. If I had to explain Greece I feel for all of the Greek people. They’re in a world of hurt and I’m not exactly sure where this is going, but it’s relatively small. They have an economy about the size of Detroit. They have an area, physically geographically the size of Louisiana. They’re really, really small but they are part of the European Monetary Union. And so therefore the question is how is that exit, you know, what’s the moral hazard if they get bailed out? Now I’m recording this on a Tuesday, they’ve already had their vote on Sunday and they’ve rejected by a pretty substantial amount, 61 percent, of negotiating and taking the first deal, well not really the first but the most recent deal that the European Union was giving them. So I feel for the Greek people. I have to tell you that it’s a little bit like having that family member who always has a big story about why they need money but no matter what they do, whether it’s a sibling or a child or a cousin, but they always spend more than what they bring in for whatever reason and their habits don’t change, their behavior doesn’t change so after a certain point you stop loaning them money. You stop giving them money. Everyone everybody in the family knows don’t give uncle Joe this money or don’t give Susie that. And so it’s a little bit like kind of that ugly sibling in the European Union right now, which is Grace. And there’s a few others that are looking to see what happens, Spain and Portugal, et cetera.
And I don’t want to minimize this in anyway because it could be a bigger deal than it is, although I don’t believe it is at this point, but it could. But when we look at history sometimes there are small events that turn out to be big events. I mean when Ferdinand was assassinated in 1914 it led to World War I. Well it wasn’t that small event of the assassination, it was all the alliances. There was a bigger picture than just that one small event. And so this could turn out to be the same thing, although I don’t believe that’s going to be the case at this point right now.
I think a bigger deal is China. I mean you’ve been hearing me for years now talk about China and how I don’t necessarily trust all of their numbers. Well, their stock market, which has just been on an absolute tear this year, just lost 30 percent of its value in the last three weeks. And so I think that those who were invested, that bubble there are also realizing that what is reported is not always the full information and so therefore it might have been priced in inappropriately before and now it’s being corrected. And so if that’s showing a slow down in the Chinese economy, that’s a huge economy, that’s something that could affect all of us. So I think that that’s something that we ought to watch as closely, if not more closely than Greece, even though Greece is a spectacular problem at this point right now.
That’s what I’ve got. I’m still optimistic going forward for the rest of the year and so I’m not making any major changes. We’re kind of in this holding period right now. There’s nothing that I’m seeing that leads me to change my beliefs from the last quarter or frankly the last year/year and a half that having a well balanced portfolio makes sense and that we’re not going to have, I don’t believe that we’re going to have this huge decline. And so I think we ought to just stay with where we are right now without any major panic. So anyway, like Brady Generosity Well Management, 303–747–6455. You have a great day. Give me a call. Give me an email. I’m always here. Thanks. Bye bye.
The first quarter was a great reaffirmation that diversification can be your friend. US Large company indexes lagged, but middle and small companies did better. US Bonds did well (in general), as did international stocks.
While diversification does not guarantee a positive return in a generally declining market, my experience is that it does tend to “buffer” some of the returns so you can stay with the plan that works for you.
In my video, I review the past quarter and continue my theme about what I’m watching to come to a “health” conclusion on the markets. Okay, I’m still bullish, but why you may ask? Click on the video for my thoughts and analysis.
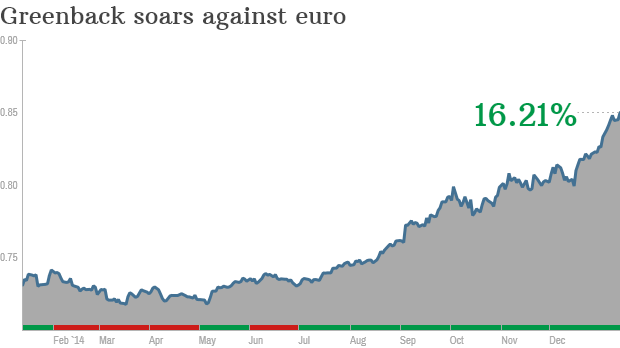
Goldman Sachs believes the U.S. dollar will catch up to the Euro and may even be equal by the end of the year.
This is just one outcome of a resurgent America in comparison to the European Monetary countries that are having all kinds of difficulty. While we ended our bond buying program, they’re just about to start.
This is good news for US travelers to Europe but bad news for big multi-national companies that do lots of business overseas as they convert back into US dollars.
2014 is now over, and a new year is in front of us.
In my video (click on the image below), I briefly do a recap on 2014, and then lay out my arguments for a long term approach, diversification, and reasons why I think being fully invested is wise, particularly as I continue to be optimistic for the foreseeable future.
Click on the video below for 10 minutes of my thoughts.
Hi there! Mike Brady with Generosity Wealth Management: a comprehensive, full-service, wealth management firm headquartered right here in Boulder, Colorado.
Today want to talk about the 2014 review and the 2015 preview- spending most of the time, I think, on the preview.
2014 was a year that was not super high or super low- it was kind of right there in between. The large company unmanaged stock market indexes were in the low double digits-positive for this year. If there was a smaller company investment it was, in general, the single digits- on the low side- kind of low single digits.
Bonds, which I believe are essential for most portfolios-in 2014 they had the low to mid single digits. I’m going to use my hands here: I think a good portfolio of stocks and bonds kind of mesh together with some cash reserves- sort of those core holdings. One thing the bonds did this year [2014] they helped to reduce some of the volatility. If you are 100% stock market index, you’re really kind of all over the place. And in 2014 there was a 7% decline in the in the S&P throughout the year. It did, in the fourth-quarter, recover from that which is wonderful- so it is positive for the year.
I’m going to put a chart up on the screen of the S&P 500 going back to 1997. What you’re going to see is there is some huge advances; some declines; advances; declines, etc. I’m going to just put a circle where we are right now. You can see here, and I put a tiny little arrow next to it, where we have that 7% decline in 2014.
I’m going to put another chart up on the screen. Now you’re going to see what it looks like going all the way back hundred and fourteen years- back in 1900. You’re going to see there are some times of great advance- and it can happen over decades. There are times of consolidation over decades as well. You’re going to see over on the right side where we are now. So the question of ask yourself are we at a consolidated period? Are we at a time of great advance? Of course there could be a decline as well over many times. So this is the environment that we have to make this decision in.
It is normal for there to be dips throughout the year. As a matter-of-fact, going back to 1900, it’s normal for there to be about three dips of at least 5%- historically, that’s what happened. It’s normal for there to be a decline of at least 10% throughout the year when we look at the numbers going all the way back for a hundred and fourteen years. OK?
Time is one of our best advantages. My advice that I give to someone who needs money in a year or two is completely different than the advice that I give when we’re planning out five years, ten years, twenty or thirty. If you’re in your 60s or 70s, hopefully you’re going to live a long life. You still have a long time horizon, hopefully, of ten or twenty years. So the more that we can keep our eyes on what the goal is; Today is point A. Point B is in the future, to keep track of what our goals are in the future the happier we will probably be.
I’m going to put a chart up on the screen. It shows, in numbers, what I just talked about. This is sixty-three years. All the way back to the 1950 of one hundred percent stocks; one hundred percent bonds, and kind of a mishmash of the two. In each one of those groupings that goes from- on the left hand side- one year and on the right-hand side- 20 year rolling time period. You’re going to see that in each one of those groupings, there are three bars and the far right hand bar is a mash of stocks and bonds. The longer out we go, the longer our time horizon has been, the range of returns- the highs have gotten lower and the lows have gotten higher. So that there is a more comfortable range I would say. Kind of gets rid of the outliers of the top outliers on the bottom. And so time is, without question, a great advantage that we have going forward. And so I constantly remind clients of- “where are we going to?” and “What’s our goal?”, “What’s our endgame?” And so, how does one quarter, one year, really fit into the bigger picture of a decade, two decades etc.?
Before we start talking about the preview, let me just tell you that I am optimistic going forward. I do believe that we’re in the beginning of one of those nice big upward swings- that could be multiple years, multiple decades. That doesn’t mean it’s going to be perfect and it doesn’t mean it will be an absolute straight line but I am optimistic about that.
I wanted to read something that Warren Buffett said (one of the best investors in history) and I really have a lot of respect for him. It is this quote right here that he said in the fall of 2008. Just to refresh your memory, the fall of 2008 was horrible! And it continued into January and February of 2009. It was hard to find people who were optimistic at that point in time. What he said is this, “Let me be clear on one point: I can’t predict the short-term movements of the stock market. I haven’t the faintest idea as to whether stocks will be higher or lower a month- or year- from now. What is likely, however, is that the market will move higher, perhaps substantially so, well before sentiment or the economy turns up. So, if you wait for the robins, spring will be over.”
What’s really interesting is after he said that the market continued to go down another 20 or 30%. And he continued to make investments all the way down. And one of the best investments that he made was actually five months after the market completely bottomed out in March of 2009. But he was committed to his conviction that long-term investments in a portfolio, and he has a well balanced portfolio, was in his best interest and when I meeting with clients we talk about how that might be in their best interests as well.
I think that there are lagging and leading indicators. “Lagging” means that the end result. So let’s say that you think the markets go up. Well, we’re not going to know whether or not that’s true or not so we looked at historically. So that’s an indicator, whether it was up or down, after the fact and then it’s too late. I like to focus on some of the leading indicators. And two weeks ago I did a video which I highly recommend that you look at. It came out around December 19, 2014. So go to my webpage look at that blog or look at the archived news newsletters. (www.generositywealth.com) But at that time I talked about some of the leading indicators about why I optimistic as things go forward in adjusting my conversation with clients accordingly.
One of them is the S&P 500 P/E ratio. Right now it’s around 16%. As it creeps up towards 20 that’s going to be a major leading indicator for me as my optimism might go towards more pessimism. I’m also going to look at earnings per share- whether or not that’s going to drop. The 10 year yield on the treasury right now it’s at 2.18 as it gets closer to 3.5, 4.0 or 5.0, I think that is going to be something that will start to give us leading indications of some problems in the future.
Declining investments percentage as a percentage of the GDP and finally, China. You’ll notice that I talk about China primarily as it relates to their economy and the impact on the world. But if you’re looking there’s always a number of reasons not to invest, not to be optimistic. You can always find every year, and 2015 is going to be no different, a reason say, “well it’s different this time!” Well, what about North Korea? What about the Middle East? What about this, what about that? There’s always, and I can sit here and point to some event, that drive the market for a relatively short time. But long-term, the fundamentals of the market win out. And in my opinion the fundamentals are positive at this point. And I’m a believer, like Warren Buffett, that the market, in general, will be higher in the future than it is today. And so we have to create a portfolio that’s individualized for us, to make sure that our behavior allows us to stay invested in that.
Just a couple of other things before I say goodbye here today: I do believe that consumer spending growth will be good going forward- particularly with lower oil prices. I think that is going to be a very positive thing. And is core inflation going to be affected this next year or two? The 2% target from the Fed, I don’t think we’re going to get close to that. So I think that interest rates are going to continue to stay low through 2015 or maybe even in 2016. And this is ultimately, I think, a good thing for us. So these are some of my argument about why am optimistic. But, in general, I’m a very optimistic person about the long-term for this and I think that it’s my client’s best interest as well. But please, don’t make any decisions without your talking to your adviser, without talking with me. It’s real important to keep the long-term vision and in your mind. But you also have to define what those goals are. You’ve got to find something that allows you, from a behavior point of view, to stay true to what your core is. That’s my preview and my discussion today!
Always I love to hear from you!
Mike Brady, Generosity Wealth Management, 303-747-6455.
And you have a wonderful day! Give me a call at anytime.
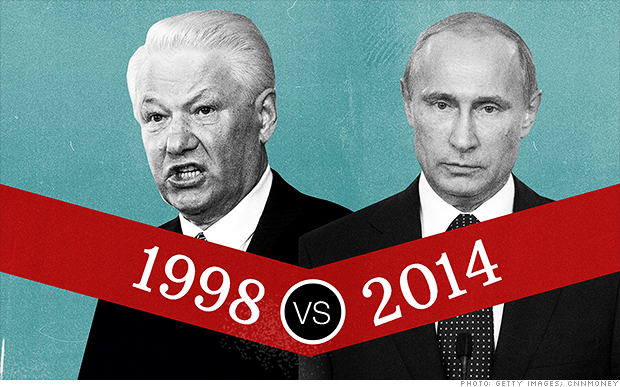
I remember the 1998 Russian crisis well. It was near the end of the summer, and threatened to put a real damper on an otherwise excellent stock market year. The “Moscow meltdown” bled over the S&P 500, which plunged 20%.
There are reasons 1998 and today are different
Tough sanction in place have somewhat isolated Western investors
Russia has a war chest of $416 billion in currency reserves today, versus very little in 1998
Russia’s currency is free floating, and not pegged to the US Dollar like in 1998. External shocks can be absorbed by the currency markets.
There are other worries in the world we can be concerned about, but Russia collapsing and spilling over to us like 1998 isn’t one of them.
I’ve mentioned all year long that I’m bullish and optimistic for the foreseeable future, and until data tells me something else, that’s where I remain.
However, what would change my opinion? What are the data that I look at, and how would they need to change in order for my opinion to change?
Good question, and one I address in this issue’s video:
Hi there, Mike Brady with Generosity Wealth Management, a comprehensive full-service wealth management firm headquartered right here in Boulder, Colorado.
The main topic for today’s video is that I am optimistic. I am very bullish and have been all year and will be until data changes. I think probably for at least another year as I look out. But what would cause me to go from bullish to bearish or pessimistic? I want to talk about that here today but first I want to address what happened in the market the last three or four days. It has been very volatile and more on the down side than on the up side. In my opinion this is one of those normal events that happen within the year. The last time we saw this was in September and October. I did a video for you in the middle of October and I said the fundamentals hadn’t changed. This is one of those steps back that we have to be accustomed to as investors and in an intra-year decline that does happen but the underlying stretch and the fundamentals hadn’t changed and that proved itself through the end of October, November, the first part of December. I am saying that here today even though the market has gone down in general over the last week or so. Am I panicked whatsoever? Absolutely not.
Let’s talk about bullish to bearish. One thing that I am going to look for and that I watch very closely is the PE ratio starting to go above 20. Once it hits 20 and above that is going to be one of my indicators to start to be concerned. I want to say that none of these – and I’m going to talk about those five – are standalone. I am going to address the very last one but my variables in this long equation are different than somebody else’s who also could be equally smart. It is just that this is what I am going to look for and I am going to talk with you about. In general I believe in the fundamentals. I’m a value investor more than I am a technical investor. A technical person would sit here and talk about what the graph looks like and use terms like “head and shoulders” and “double tops” and all types of patterns within the graph of the market. I am not going to do that here. That is not what I believe long term is going to be more successful for clients.
I look at the fundamentals of the economy and the impact that it is going to have on the actual stock market. The economy of a country can do poorly but if the stock market was underpriced it can actually still do well and vice versa. If the economy is doing really well and if the market was just overpriced then it either will stay stagnant or go down in order to get in sync again with that particular economy.
I’ve already said the PE ratio is one thing that I am going to look at once it gets closer to 20. It is now at 16.1.
Earnings per share drop – that is something that I am going to watch out very closely. Right now it is very strong but once it starts declining, I think that is going to be a long term signal that we are headed for some trouble.
The yields of a 10-year treasury. A 10-year treasury right now is 2.09 as of the date that I am recording this. It has frankly been all over the place. Incredible volatility in the last year or so. It has been as high as about 3% and this is actually the lowest that it has been in a very, very long time. A year and a half or something like that, maybe two years.
The fourth thing I’m going to look for is declining investment spending as a percentage of the GDP. There is a great number and a great graph that I watch and as we are watching a declining of a company’s investing and their investment spending that means that they are concerned about their own market, their own change, and their own profitability that I think is going to be a very bad sign which is going to be a leading indicator of lower earnings per share in the future.
The last thing that I am watching very close is China. China is the world’s largest market at this point. It has surpassed the U.S. economy and whereas we get a cold and the world gets sick, well China now is a huge partner in that as well that when they get sick. When their really strong, unbelievable economy starts to slow down that is going to really have a major ripple effect. There is a statistic I heard over the weekend that with all of their building in the last three years, they’ve used more concrete than the United States did in 100 years. They’re incredible. There’s so many. There are three times the number of people that we have. More than three times, three and a half times and just an incredible country and it is something that I am watching very, very closely. That being said, if there are any questions about what I’ve said here today, I will continue to look forward on these things as the years go by but these are what I think are very important. If you have a different point of view, hey, I am open to it. Give me a call and we can have a great conversation.
Mike Brady, Generosity Wealth Management, 303-747-6455. You have a great day. Thanks. Bye, bye.