There are endless things to worry about. As a matter of fact, in my 24 years of being in business, I can’t remember a year when I wasn’t worried about something.
However, you’ve got to keep that in check. As the graph below in the next article will show, if you are constantly running from the bad years, historically you’ve missed out on the vast majority that are positive.
I think 2016 will be another one of those positive years, but if I’m wrong, I’ll keep to the diversified principle that I believe makes sense.
With an unmanaged stock market index going back to 1926, 73% of the time U.S. Stocks were positive. When you add in the “slightly negative” column of declines from 0 to 10%, that adds up to about 87% positive or slightly negative.
The future could absolutely be different, and you have to ensure it fits with your individual goals.
“Every journey in life has a destination.” — Ken Poirot
In today’s video, I share a conversation I had with a friend of mine, who is a surgeon. How does he handle things when the surgery outcome is unknown, and in the middle of the operation if things go awry? How do you stay calm?
What he deals with on a daily basis is the same as investments and your financial plan. How do we keep our eyes on the big picture? What is normal, and how do we stay calm?
One of the benefits I bring to my relationship with clients are the 24 years of experience, and in that time I’ve seen just about everything. The behavior and attitude we bring as investors is probably the most important variable in reaching our financial goals. At least, that’s been my experience.
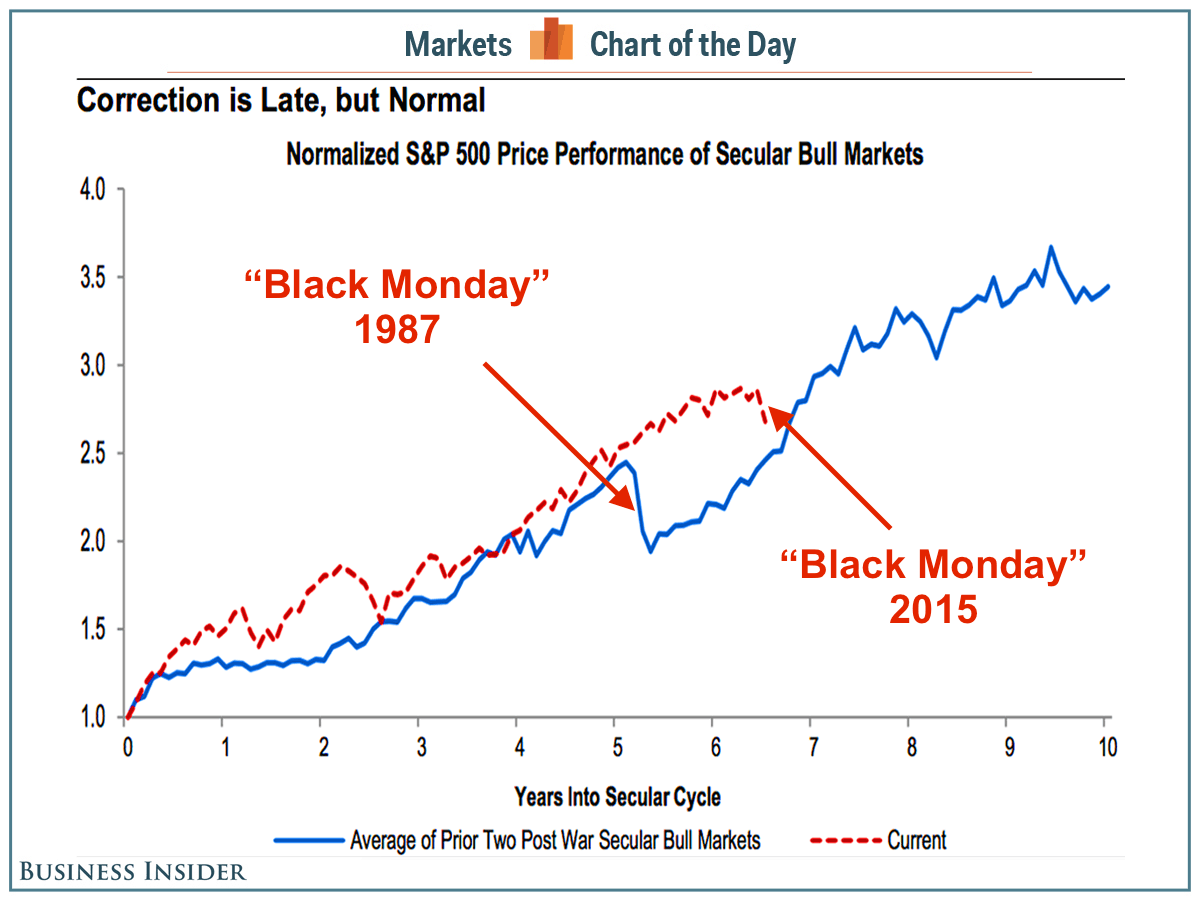
It is normal for there to be corrections with a generally bullish market, which we’ve been in for 6 years now and I believe will continue.
The chart above does NOT mean our RED line will continue, as it could be the end of the bullish trend. I don’t think so, but it’s possible. I’ve made the argument many many times why I’ve come to my conclusion (see previous newsletters and videos going back 2 to 3 years).
We have 3 months left in the year, but more importantly, if you’re invested in the stock market in any way, you should have years in your time horizon.
I still owe you a video on China, and how I think it’s going to impact things.
It’s tough in that we’ve never had such a large player be so guarded in it’s data.
Economists for now are continuing to be optimistic about China, predicting a positive growth for 2015 even though the markets and their currency have gone haywire.
More to come next few weeks as I complete my analysis and video on China.
“Life is Really Simple–but We Insist on Making it Complicated” – Confucius
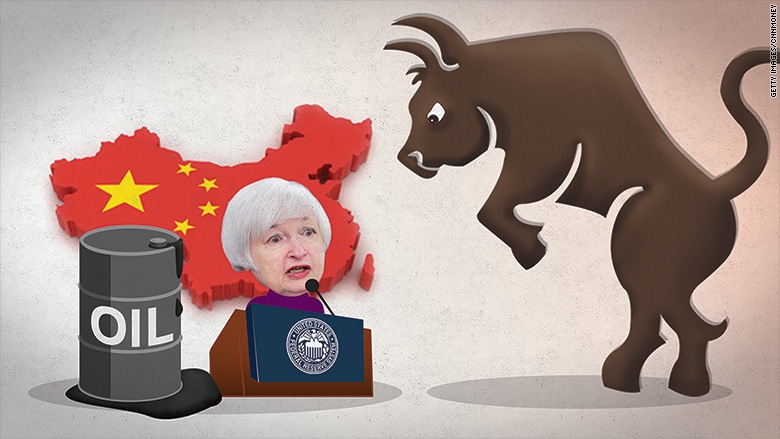
Over the next couple of weeks I’m going to talk about the reasons given for the market correction
1. Plunging Oil
2. China
3. Disappointing Profits
4. Trading Milestone (200 Day Moving Average)
5. Rate Jitters
Today I focus on Oil, as it’s declined from approximately $60 in June to $40 today. What is that indicative of, and is that a long term benefit or detriment for the economy?
I say it’s a long term benefit, and make such an argument in my video.
Click below
Hi there. Mike Brady with Generosity Wealth Management, a comprehensive full-service firm right here in Boulder Colorado. I’m recording this on Thursday, August 27. Last video I recorded was last Friday. And Monday and Tuesday of this week very exciting; huge plunge in the unmanaged stock market indexes. Wednesday, yesterday from my point of view and so far today we’ve had a nice rebound. So it’s important to remember that even when there’s big ups in the market taking four steps forward, sometimes we take steps back. Well, the opposite is true. When a market is going down sometimes we have nice rebounds. And so I would anticipate, and it is normal for there to be a seesaw, some downs, some ups, et cetera, and so I wouldn’t read too much into a huge decline or too much into a huge advance at this point. I go back to my first video where I talk about, the video from last week, where I talk about what’s your time horizon, what’s your plan and what’s your conviction. I highly recommend you go back and watch that video.
Today I want to talk about some of the reasons being given for the decline in the market. There are five things, I have written them down here that you’ll read about. The first one is plunging oil and that’s what really today’s video is going to be about. Second one is fears about China. We’ve been talking for months and for years about China and so this should not, if you’ve been watching the videos and reading my newsletter, this should not be a surprise to you. Third thing is disappointing profits. The fourth is trading milestones like the 200 day moving average, there’s certain technical indicators. The fourth thing is rate jitters, which is concern about what the Fed might do in September.
Let’s focus just on plunging oil. What the heck does that mean? Back at the end of June oil a barrel was over $60, today is closer to $40. That’s a pretty huge move in just a couple of months. Now it’s good for us to remember that oil is an input into the equation of expenses for a company and for you as an individual. So would we want – so there’s lots of different variables: employee cost, oil, the cost of manufacturing, all your cost of goods sold. And those costs are passed on to the consumer. So it’s good for us to remember that. I mean if there’s an increase in one of those variables, in order for a company to be viable they have to pass on their expenses to the consumer so ultimately you pay for that consumer. Or, when you go to the gas station would you rather pay $30 for a fill up or $40 for a fill up? Of course $30. Now that allows more income to be diverted towards other things. So if I’m now spending $30 where I used to spend $40 for my gas tank, then that gives me $10 to go into the grocery store, to the movie theater or whatever it might be and help my economy in that way or enrich myself or reinvest that extra $10. From a company point of view, the vast majority of companies are helped by a lower cost of that input than are hurt. There are some that are hurt. I’m not going to lie to you. Some of the oil and energy companies are hurt by it, but let’s just look at the unmanaged stock market index, the S&P 500.
The top five sectors are technology, with about 18 percent of that unmanaged stock market index; healthcare of about 16 percent; financial services 15.5; consumer cyclical about 11; and industrials about 11 percent. You add all those things up and 70 percent of the S&P 500 unmanaged stock market index sector wise is non energy related. And it’s not that the other 30 percent is energy related, it’s these are ones that are going to be helped out, the vast majority, the greater good is with oil being at a lower price.
I’m going to throw up on the screen there real quick just oil production. You can see that the U.S. oil production, I put a red arrow next to it, has significantly increased in the last two and a half years. And so what we have with the price of oil is, and one of the reasons why people have concerns about it, is it can be an indicator of the health of the economy. So when the manufacturing is slowing down you demand less oil. And so therefore when you see less oil then that means that the economy is slowing down. That makes sense. However, that’s not the entire equation on the price of oil, it’s price and demand. So if demand is decreased – in this case we’ve had some demand decrease, which is true, but we’ve also had incredible production. So it’s not just the demand, it’s also the galots [ph], the quantity that’s available is significantly greater and increased and so therefore even with the same demand the price would have gone down. The fact that we’ve got some lesser demand just kind of exacerbates the particular problem.
I’m going to throw another chart up there real quick. You’re going to see the economic drag as JP Morgan has done it. You can see that lower price provides less of a headwind against the particular GDP for our particular country. This is a good thing. And so my whole summary of the video is yes some are hurt by lower oil prices and some of the stocks that are tied to that, energy in the S&P 500 unmanaged stock market index and some of the other unmanaged stock market indexes are hurt, or if it’s a part of a diversified portfolio and things of that nature. However, the greater good over the long-term, the one-year and the five-year of having more money that you can reinvest or to repurchase and put into the community is a good thing overall. So I see this as a good thing, not as a bad thing even, though there might be some short-term impacts and that might be one of the five reasons that have been given.
I’ll talk about China, I’ll talk about rate fear] in subsequent videos, I’ll talk about the trading milestones, some of these other things so that you’re well formed over the next couple of weeks. Mike Brady Generosity Wealth Management. 303-747-6455. You have a great day. See you. Bye bye.