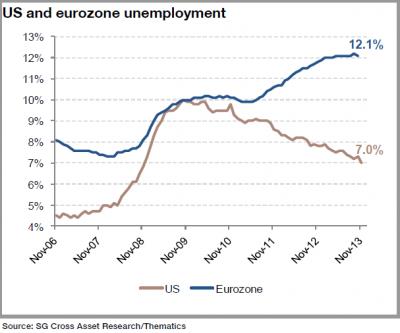
This is particularly disturbing when you see teen and young professional unemployment in the 25% unemployed range.
The European economies have some real trouble now and in the future. What is interesting is that many of their stock markets are positive for the year.
This goes back to my statement in a previous newsletter that the stock market of a country does not necessary move in step with the economy.
There are two measures of jobs in my mind: Quantitative and Qualitative.
I’m pleased that slowly the quantity of jobs seems to be coming back, although anemic, but the quality of those jobs is still lacking.
I think we’re in the midst of a major re-adjustment in our country, about the type and quantity of jobs we have to offer.
I am not pessimistic in any way, and feel the creativity and entrepreneurial spirit is better here than anywhere, but the adjustment will continue to be painful.
Here’s a full article on the most recent job numbers
The Unemployment Rate increased to 8.2% this past week and will continue to be one of the biggest pieces of news this summer and leading up to the election.
The problem with the number is that the employment – population ratio has a huge impact on it and it’s been shrinking.
If you’ve left the job market, either through retirement, going back to school, or simply not looking for a job in the past 4 weeks, then you leave the eligible job pool.
It has been shrinking for quite some time, and artificially makes the official job numbers look better than they really are. With Baby Boomers leaving the force in record numbers, some of this is to be expected, but it doesn’t account from the whole picture
Goodbye 2011 and hello 2012! What happened and what’s my outlook for 2012? Optimistic or pessimistic?
Watch my video to find out.
TRANSCRIPT:
Hi there, Mike Brady with Generosity Wealth Management, and today I want to talk to you about a little bit of a review on 2011, but spend most of my time talking about the current situation right now. And you know, maybe do a little bit of a, …, thinking about 2012 and what the future may hold.
2011 was a real volatile year. I mean frankly, when we look back at year upon year we can always say that it’s very volatile. I’m going to show you a graph in a minute or two that actually shows, we kind of forget about it, but many years have large declines intra-year. So 2011, (I’m going to throw this box up there); this is kind of a style box from value, blend, growth, and large, and mid, and small cap.* And by the way, I’ve got lots of disclosures at the end of this video so I highly encourage you to read those disclosures about the unmanaged stock indexes. So what you’ll see is, in general, the U.S. market was up a couple of percent to down five or six percent, but it was a wild ride the way we got there.
The first four, four and a half months of the year were up starting in May and June, we saw some weakness and then August and September were really quite brutal. Just huge, you know, hundred point swings in the DOW every other day and it was really quite painful and there was a huge focus on the downgrade of the U.S. government by S & P and a real focus on the U.S. federal debt. And, you know, 2011, one of the surprises was how well bonds did. I know I’m very surprised. And Bill Gross, who runs one of the largest funds out there, particularly bond focused funds, he admitted half way through the year, well maybe three quarters of the year, that he guessed it wrong. So, I think that how well the bonds did in 2011 is going to be the big surprise. But that’s why we remain diversified. Because my experience has shown, in twenty-one years, that the thing that you love the most sometimes you’re just darn wrong about! And so the thing that you hate the most, sometimes you’re wrong about that as well. So it’s really looking at the percentages, maybe weighting one over the other and changing that allocation throughout the year.
So you’re probably wondering about 2012. Right here in my hands I’ve got “15 Experts Predict 2012,” a little article. And we’re talking big names, Goldman Sachs, and UBS, and you know, kind of every big name that you can think of out there. And frankly, one article says that China is the best thing in the world, then the next one says China’s going to be a problem. One says that the U.S. is going to have great growth and the next one says it’s going to have poor growth. One saying bonds are good, one bad, and really the answer is always unclear, this year is no different.
I do believe we’re going to continue to have volatility, and one thing that I’m going to do is meet with clients and talk about whether or not some strategies need to be implemented to take advantage of that. But I am optimistic about 2012. I’m going to throw up a chart here; we’re going to see that the percentage of current assets that are in cash and equivalents has increased. And from a corporation point of view, that makes a lot of sense. I mean that when there’s uncertainty, you’re not sure how many widgets you’re going to be able to sell or how many services you’ll be able to provide, you want the best balance sheet that you can have. And I think the best recipients, when that cash gets converted back into research and development, gets back into the economy, I think that mid and small cap companies are going to be the ones that are kind of the first beneficiaries of that.
2012, I feel will be event driven, just like 2011 will. [sic.] We’re going to hear lots of stuff from Europe, and we’re going to hear a lot about the debt, and of course this is an election year so we’re going to hear all about, all about the election year politics. But I think we’re also going to hear about China. That’s going to come in here because it’s had a huge growth. It’s been one of the largest, kind of emerging into the developing markets, but it’s faltering. And this could be the year where it kind of teeter-totters to the bad side. So that’s something that I’m going to really watch out for.
I’m going to throw up here on the chart, that as it relates to volatility, here’s a chart that, we kind of forget about it but most years have some kind of volatility. The bottom number is entry year, kind of decline, and that does not mean that the year ended. The black number is actually what the year ended. So although there might have been a double digit decline throughout the year and everyone kind of freaks out, you know, it’s not over till it’s over. I’m here in Boulder and we got our Denver Broncos and between the fourth quarter and overtime, you know, the game’s not over till the whistle blows. And so throughout the year if we have some huge declines we have to assess at that time, “hey, wait a second, is this going to continue, or is this just one of those throughout the year declines that we still feel firm in our analysis that the market may be under-valued?”
Speaking of the market being under-valued, I don’t hold much weight with forward price to earnings ratios, but I do like, not the forward, but the actual price to earnings ratio is low right now. Particularly in comparison to like the twenty year average and what it’s historically been. So I’m kind of in the Warren Buffett camp that believes that this is a market that is under-valued; that the economy is actually getting better, it might not feel that [sic.], particularly if you’re unemployed. I mean we have an unemployment problem, and we have a housing problem. But you know, I’m kind of in that camp.
You know I could sit here and go on and on and on. But I think that I’ve gotten my feelings out to you that in general, I’m optimistic about 2012. I think that small and mid-cap are probably kind of the styles that deserve closer attention. But you’ve got to, of course, do what’s consistent with what your risk levels are, and your particular goals. And work with your financial advisor and hopefully that financial advisor is me, but if not, of course, everything I say here today is kind of general, so you can get a general feel for how I’m thinking.
That’s it for 2012.
Mike Brady, Generosity Wealth Management; I do have these videos on a weekly, sometimes every other week, depending on how busy I kind of get and if I’m able to get it out in time.
I am a full service wealth management firm, here in Boulder, although I have a number of clients in many different states. I named it Generosity Wealth Management because I truly believe that people are trying to make the world a better place and that includes making things better for themselves so that they are not a burden upon others in their own retirement. That they make things better for their family – so that they can pass money on to their family or just provide for them; whether it’s a college education; whether or not it’s just to make their life a little bit easier. But also to make their community a better place- both local and global community. And so there’s some “generosity” that each of us have inside us. And that’s many of the thoughts that went into my company name of Generosity Wealth Management.
303.747.6455
www.generositywealth.com
And please, stay tuned, I will have another video and another newsletter before you know it. You have a wonderful, wonderful day- bye bye.
* Small Cap- refers to stocks with a relatively small market capitalization. The definition of small cap can vary among brokers, but generally it is a company with a market capitalization of between $300 million and $2 billion.
Mid Cap- refers to a company with a market capitalization between $2 and $10 billion, which is calculated by multiplying the number of a company’s shares outstanding by its stock price. Mid cap is an abbreviation for the term “middle capitalization”.
Large Cap- A term used by the investment community to refer to companies with a market capitalization value of more than $10 billion. Large cap is an abbreviation of the term “large market capitalization”. Market capitalization is calculated by multiplying the number of a company’s shares outstanding by its stock price per share.
Keep in mind that the dollar amounts used for the classifications “large cap”, mid cap”, or “small cap” are only approximations that change over time. Among market participants, their exact definitions can vary.
Definitions courtesy of www.investopedia.com and reflect a general rather than specific understanding of these industry terms, unless otherwise stated.