Pimco is a mutual and ETF firm with a huge bond fund that has been the player in that space for the past 40 years. Bill Gross founded the firm in 1971, and it is now around $2 trillion dollars under management.
Last week Bill Gross decided to leave the fund and move to Janus. This is important because of the disruption to the bond market as huge sums could (and I say could) move from one firm to another.
The bond market doesn’t get as much coverage as the stock markets, but this is a pretty big change, equal to the Denver Offensive team picking up and going to Oakland. Heaven forbid.
The 2nd quarter is now behind us, and the momentum is with us! Will recent global political events derail the positive trend?
Good question, and one I answer in the below video
Transcript:
Hi there, Mike Brady with Generosity Wealth Management, a comprehensive, full service, wealth management firm headquarters right here in Boulder, Colorado. Today, I want to talk about the second quarter review. Really kind of the first half of the year review and then a third quarter preview which really turns into the rest of the year preview as well.
The first quarter of this year, we had some drops in January and February. Some people were saying, okay. This is after a strong 2013 that means 2014 is going to be negative or really hard. Well, March came back and the first quarter of this year really was break even to positive just a little bit. Now, when we go into April, May, and June which is kind of the second quarter, it continued to be a very strong stock market. The unmanaged stock market index, the Dow Jones Industrial which is the one that we hear about the most, is up about 1.5% for the year, but when we actually go to a broader basket of stock, whether it be S&P 500 or other indexes, you are really looking at the first half of this year being between 2% and maybe 8% or 9% depending on what index you are looking at. These are for unmanaged stock market indexes.
I am going to throw up there on your screen a particular chart that shows what the S&P 500 has done over the last 17 years or so. You are going to see since 2009 the market has, without major interruptions, gone straight up, so it’s really been a very strong market and one that I have to say if we were talking in March of 2009 after seeing the fourth quarter of 2008, remember how 2008 was so difficult, who would have thought that things would have just skyrocketed ever since then, but yet, that is exactly what has happened. It’s a good lesson in humility that when everybody else is so certain that it’s going to continue to go down, many times that’s a buying opportunity.
I want to throw another chart up on your screen. You are going to see that the price to earnings ratio in general is a little bit more expensive than the average of where it was one year ago. It does not mean that it is ready to decline, but I’m just saying that it is not as quite the bargain that it was a year ago or even on average. When we look at the late 1990s right before the big crash of 2000, 2001, and 2002, many of the markets were having the PE ratios in the 20s, 28 or 29 stuff like that, and the NASDAQ was off the charts, almost 100, so I do want to keep everything in perspective.
We will go to the next chart and there you are going to see that the earnings per share are looking really good and profit margins as well are looking really strong for companies. In general, I think things are disturbing that last quarter there was a negative or contraction in the GDP, the Growth Domestic Product, I think that it’s something we have to really watch out for. One thing that is good about it though is if it stays difficult I think that the fed is going to have even more of an incentive to keep interest rates low. Remember when we had quantitative easing and they were buying a year ago $85 billion worth of bonds which was keep a lot of liquidity in the market. Well now they are doing $35 billion a month and by the fall of this year according to the June meeting notes, they might even stop the purchasing all together. Now there is an awful lot of liquidity in there. I don’t think that this is going to be a huge interruption and disruption to the market, but it is something that we need to keep in mind. Now, even if they stop, I think that the interest rate increases will be very, very gradual and very, very slow.
I am going to throw another chart up on the graph and you are going to see the corporate cash is very high as an economy and we are going to see on the next sheet there that it is normal for there to be decline throughout the year, so we have had already about a 6% decline in the market. That was through January and February which is actually about a normal, even actually on the low side of volatility. As we go forward, there might be some more volatility, let’s hope that there’s not, but so far the year is looking really nice.
Now, I am going to throw this next chart up on the graph and that’s going to show you since 1900, so that’s 114 years of course, and you can see that there has been a breakout. It has a tendency to have the consolidation period and then some advances. Of course, in the 1930s there was a decline, a huge multiple year decline, but when we do these trend lines you are going to see that there is periods of consolidation and then a breakout. In my opinion, I think that I am very bullish on the market on the United States and I think that this is something that is going to be before long laughing. That being said, we don’t live in just a stock world. There are other asset classes as well.
Let’s go to the next graph and you are going to see that apartment real estate, in particular is what I am talking about, apartment vacancies is at bottom line here. That’s a good thing. You want vacancies to be really, really low, and so when you can see that office vacancies have increased a little bit through 2009 and 2010, but have been coming down since then, you’ve got retail, industrial, and apartment, and apartment is looking the best from a real estate point of view, from at least a vacancy point of view. Of course, you got to get them at really good pricing and things of that nature.
We are going to go on to fixed income which are bonds. We are in a low yielding environment, so there is a lot of chasing of yield, so people are trying to get a higher and higher number. Right now, just to show you, you can get the two year treasury at only at .5%, all the way up to 30 year so far is year-to-date is yielding 3.34%, but if you would have bought it, it was so depressed last year that it actually has increased in value this year into the double digits. Frankly, last year big dog was one of the worst performing sector is this year’s performance. That’s the reason why you want to have, put my hands up here, stock and bonds. You want to mix them all together. In a perfect world, you’d have sometimes the stock pull up the bonds, sometimes the bonds pull up the stock. Here we have both of them going up together which is actually really good. Believe it or not, the bonds are pulling up. If you have a high bond allocation, they are actually pulling up the stock portion of your portfolio so far this year where as last year it dropped it down which is kind of interesting.
From a global market point of view, I am going to throw a chart on there. The important thing to know about this chart is in comparison to historical averages, much of the developed world is expensive from a market point of view. Of course, we just went through the price earnings ratio for the U.S., and that, I already showed you, was a little bit higher than the average while many of the developed countries are the same way. Now, when we go out to the emerging market which is the next sheet there, you are going to see that there is some real bargains there with Russia and China, but of course we have political instability there, political instability as in the – in my opinion, how much can you trust it, things of that nature. Are the real numbers true, etc. Maybe they are not political instability as in they are practically dictatorships, but that’s beside the point. When we look at some of the other emerging markets, they too have a tendency to be a little pricey.
Let me end up here by saying I continue to be positive for the rest of the year. As a matter of fact, I have a tendency to be positive for the next couple of years, and I think we need to have a well-diversified portfolio, but be a part of it. Keeping money on cash or CDs is absolutely not the right solution, in my opinion. Time is on our side, so I am going to put a chart up there and what this chart really means is from 1 year to 5 years to 10 years to 20 years, the farther out you go historically looking back all the way back to 1950 and it could be different in the future of course, that the longer you can be invested from 5 years, 10 years, all the way up to 20 years, you’re range of returns, the high-highs were because there are some higher loads as well and so they have the tendency to get into a range there. Over time, there actually hasn’t been a 5, 10, or 20 year timeframe where a 50/50 portfolio of stocks and bonds has actually lost money. That absolutely could happen in the future and so I just want to be realistic about that. However, what we are trying to do is, of course, trying to set ourselves for success so that the super low-lows we can try to trim those so that we stay invested and that we don’t let our emotions run wild. Of course, we would love to have the high-highs, but unfortunately, the downside of being diversified is the downs, the lows have a tendency to bring some of those highs down as well.
That being said, I continue to be optimistic for the rest of this year and even going into 2015 with the Presidential Election. That’s what I got. Hope this wasn’t a little too long. Hopefully you listened through the entire thing. My name is Mike Brady, Generosity Wealth Management. Give me a call if I can help in any way, 303-747-6455. Thanks.
Do you know your life expectancy? What does life expectancy really mean, and why should we care?
These are the questions I answer in my video this newsletter.
Therefore, you should watch my video.
Hi there, Mike Brady with Generosity Wealth Management, a comprehensive, full service, wealth management firm headquartered here in Boulder, Colorado. Today I want to talk about life expectancy and withdrawals and Medicare and Social Security, etc. To be honest with you I only have three or four minutes so I’m only going to give you a little teaser and then I’m going to follow up in the next video.
The first one is life expectancy. If you are 65; I’m going to put up on the chart there, on the video, a chart. What you’ll see if you are 65 years old and you are a woman you have an 85% probability of living up to age 75. That’s a high probability of course. If a couple that are 65 years old the probability of one of you living past 75 is almost assured at 97%. We go out to 80, 85, 90. Let’s just look at 90 years old; if you’re 60 years old, from 75, 85, that’s 25 years to age 90. If you are a woman you have a 1 in 3 chance of living to 90. Periodically I’ll meet with someone who will say; well you know my mother and father they died in their early 80s and there’s no way I’m going to live to 90. Well, you know what, there’s a 1 in 3 chance that you will. Do you want to be that one and spend all your money in the next 25 years? Probably not; plus, many times our parents, that’s just kind of the way it worked. That generation they were smoking and drinking and all kinds of stuff and now we’re always eating kale and gluten free stuff so chances are we’re probably going to live a little bit longer. That’s what statistics have shown us.
One of the values that a financial advisor brings and I always bring to the relationship with clients is life expectancy, that’s usually; if my life expectancy is 85 or so I’ve got to make sure that I plan for much longer than that because that’s using the average. I think that chart there starts to show it. The reason why I bring that up is in retirement; I’m now going to throw one more chart up there for today and what you’re going to see is extending my age and category. From left to right it adds up to about 100%, some rounding and stuff like that, but the gray is the 10 years leading up to retirement at age 65. Then you hit 65 and then above. What you’re going to see is some housing and other increases as a percentage. Transportation goes down. Medical care of course goes up, etc. What we’re going to see on the bottom there is the average inflation from 1982 to 2013 of those particular categories. You’re going to see the medical care which is a higher percentage has a tendency to increase. You know this; you’ve been paying attention the last five years and I’m stating the obvious. Other things; housing is still almost 3%. The percentage of; the items that seem to go up as a percentage of your income also has some high inflation to it as well. That’s something that we have to keep in consideration. We live longer than what we think we’re going to do and many times things are more expensive than what we think as well.
Gosh, do I have time for one more really cool thing here? Here is the variation in healthcare cost. See that little graph there, the little United States there? What you’re going to see is the annual Medicare cost and in Colorado we’re right in the middle. We’re not on the cheap side like many of the world in blue, we’re between $3750 and $4500 and then $4500 after that entry has to do with those with traditional Medicare and comprehensive Medicare depending on where you live in retirement. We’re going to talk a little bit more at another video of some long-term planning, withdrawal strategies. One of the things that a financial advisor brings to the relationship are all the strategies about the de-accumulation of the portfolio; you’ve got the accumulation stage where you’re trying to save money and 401(k) all this type of stuff and then you hit a point and then it’s the de-accumulation. What’s your strategy? What’s your mix? How can you set things up to limit, to make the probability that you’ll outlive your money as low as possible because that’s of course a bad thing. These are some of the things I’m going to talk about in upcoming videos. Nice to talk to you today, sorry it’s so short but I did want to be short and pippy.
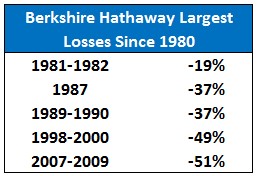
When you hear 9 – 10% in the stock market, you must remember that those returns contain every single type of market environment.
Warren Buffet is one of the most successful investors ever, and he still has declines at some point. But, he has the right behaviors ingrained in him to “be greedy when others are fearful, and fearful when others are greedy”.
No one likes declines, but they are part of a full market cycle. When constructing a portfolio for a client, I always try to understand the risk tolerance for them, understanding that unless you’re 100% invested in the stock market, you won’t get 100% of the ups (desired) and downs (undesirable) of that market
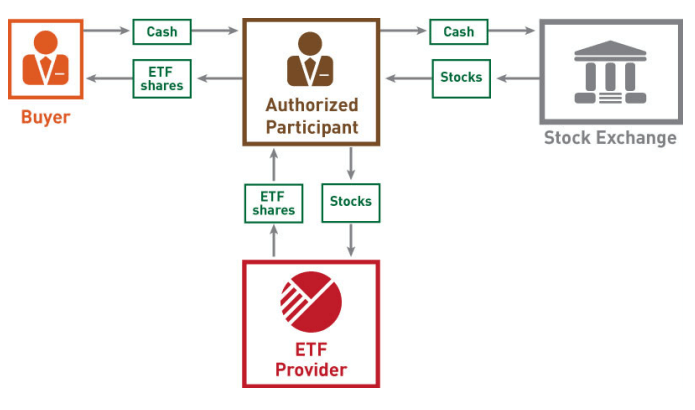
It’s BBQ season, and I want my clients to be the smartest in the neighborhood! So, when the conversation drifts away from FIFA World Cup and towards how International ETFs work, you’re totally going to be ready.