– Buckingham Strategic Partners
I promised in my last video (March 12th) to have a longer discussion about the current economic and financial situation. You’ve got it right here! And with graphs!
Watch our video to hear more!
________________________________________________________________________________________
Transcript
Hi clients and friends. Mike Brady here with Generosity Wealth Management, a comprehensive full service financial services firm headquartered right here in Boulder, Colorado. As you can see from the backdrop I am back in my office here in Boulder. The last two videos I did from Orlando. I’m going to make today’s video a little bit longer. When I’m traveling it doesn’t matter with today’s technology except when you want to do a newsletter with big video files and transfer, et cetera, and that gets a little irritating I assure you.
Lots going on in the world and in the markets and I want to talk about some of the implications. Let’s first put up on the screen a graph. On the left hand side that is the unmanaged stock market index, the Dow Jones Industrial average. The left access is percentage rate of return. And what you’ll see is for the first one-and-a-half months of this year it was positive, and then it took a huge sharp downward over the last three weeks or so. It is rebounded slightly because of the nice Friday that we had. However, it is definitely near the bear territory. It dipped into it which means a negative 20 percent decline. So it dipped below and then it’s kind of popped back up, but it is right there at that cusp of what we technically call the bear. Not good at all.
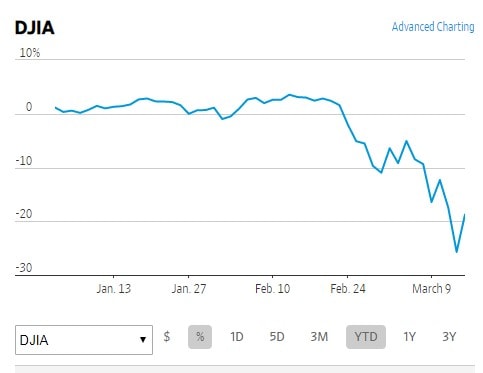
One thing that is important, we always talk about from a military engagement point of view that everyone’s always fighting the last war. Every general is fighting the last war or it seems since the Vietnam War everything is always compared to Vietnam. Well, we now seem to compare everything to the 1987 decline and the 2008 decline. I’m going to talk here in a few minutes about why it’s not 2008.
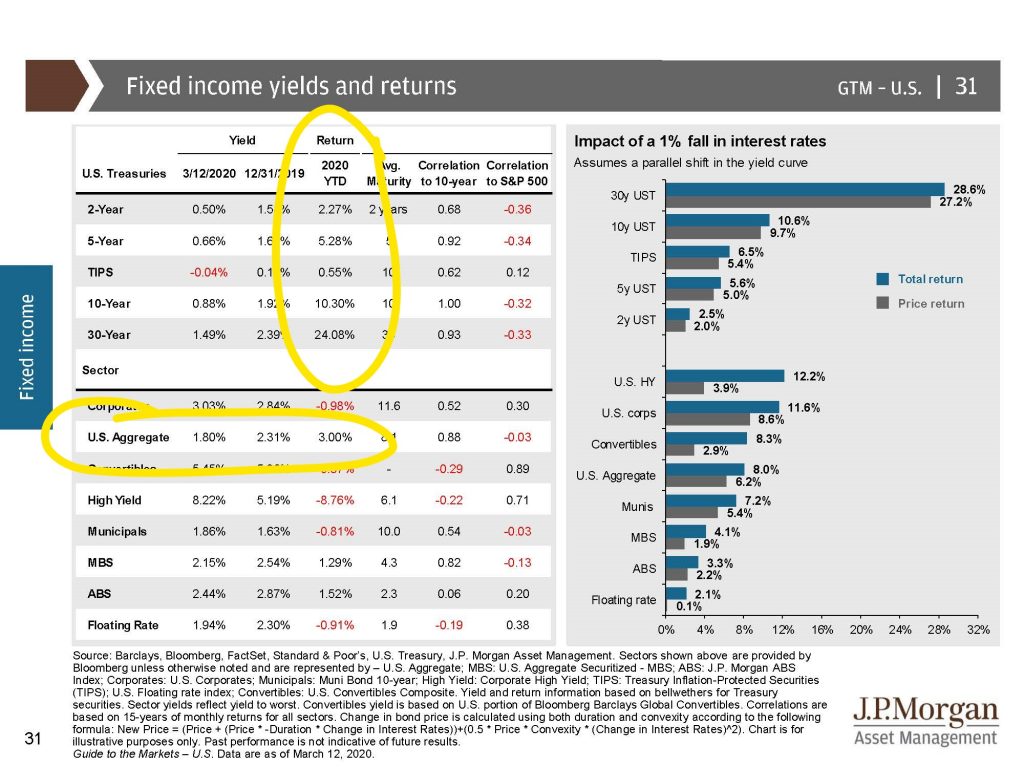
Before we move on though I want to talk a little bit about bonds. Bonds have done well. I’m going to put another chart up on the screen. What you will see is they have done what they’re supposed to do which is go up when stocks go down. The correlation meaning it’s very highly correlated if they do the same thing as the stock market. It is negatively correlated if it does the opposite. And what you’ll see is a portfolio of stocks and bonds. The stocks have gone down but the bonds have gone up. And whether or not a particular portfolio has gone up or down is how much of the mix you have. I’ve said in previous videos that over the long term it’s my belief that you’ll be happier over ten years the more aggressive that you are, but that doesn’t mean on a short-term basis whether that’s months. In this case it’s been weeks, even days frankly, but on a year-by-year basis you’ll be unhappy because the volatility increases.
I’m going to put one more chart up there. The third chart is over the last 20-30 years.It is since 1980 and what you’ll see is the bottom numbers or the red numbers, those are the intra-year declines, the declines that happen within the year. And then you’ll see that the gray number,I’m not sure how it’s going to show up on the screen, is what it is the year and the data. And, of course we’re just starting off the year not even three months in. One thing that’s important to note is 1987 which people talk about all the time that actually was a positive year. Most people think that it was some huge negative year for the stock market when it actually had made lots of money through the first two-and-a-half quarters and then it gave it all up in a spectacular fashion over a day or two. But it actually ended the year positive.
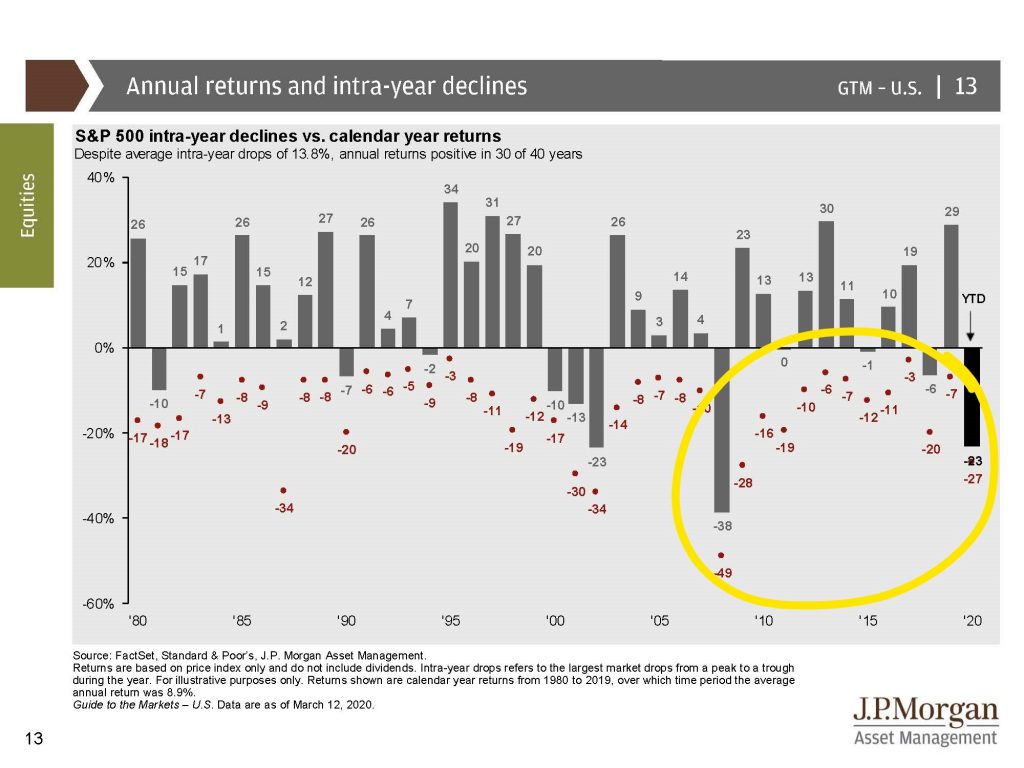
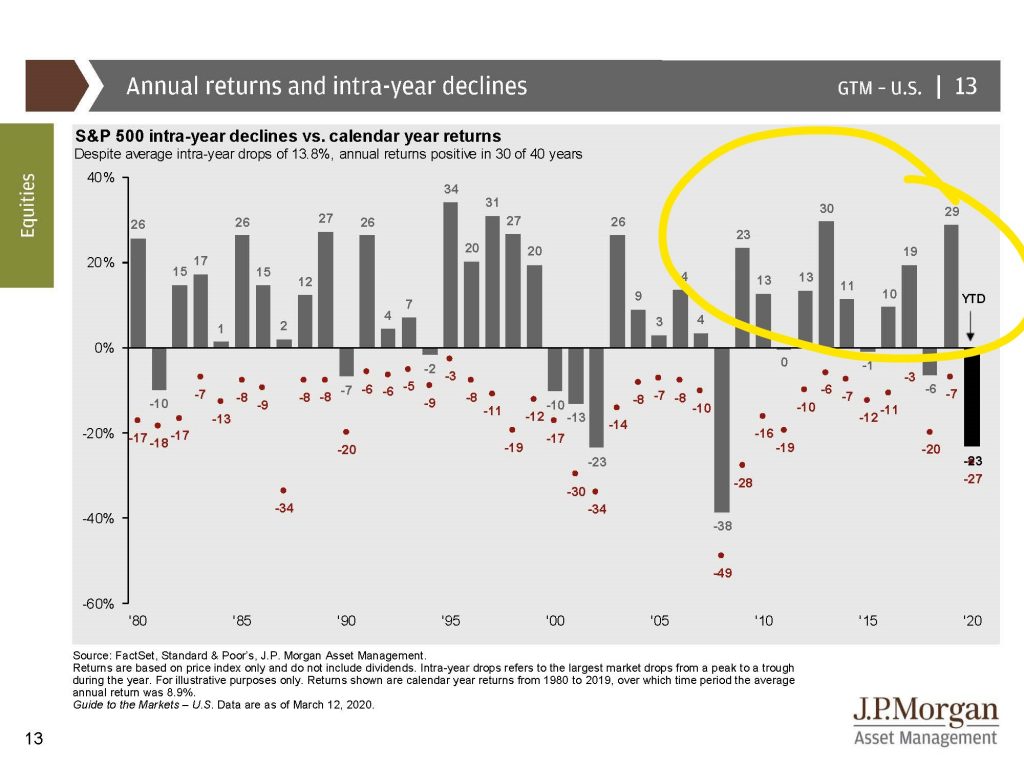
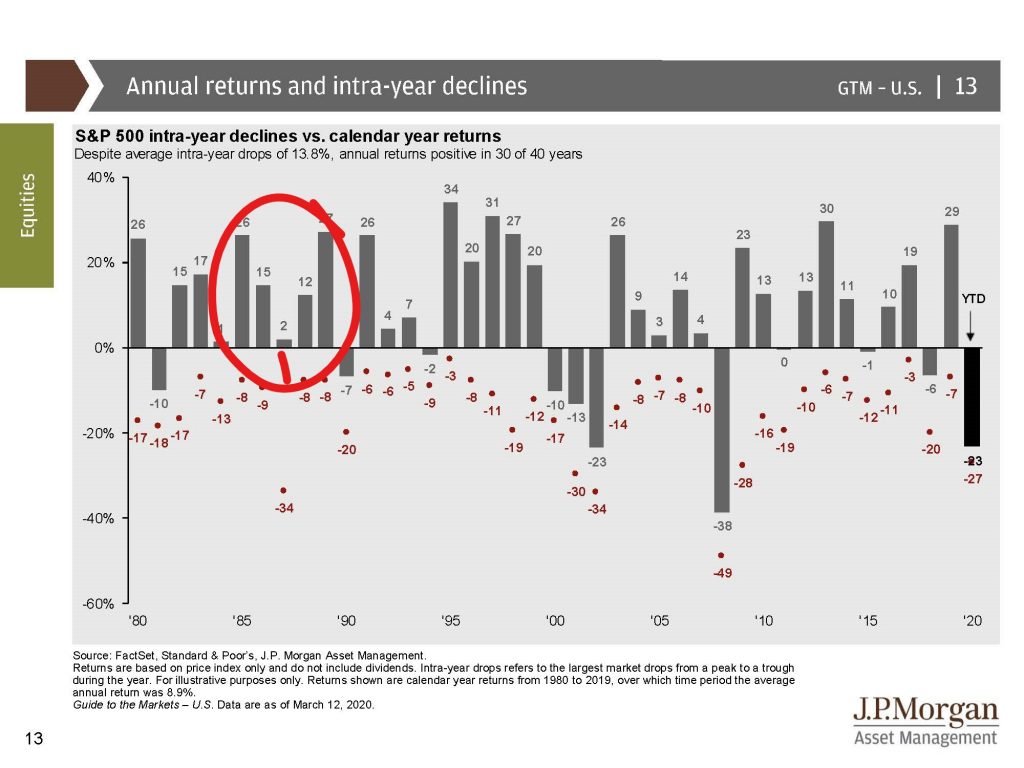
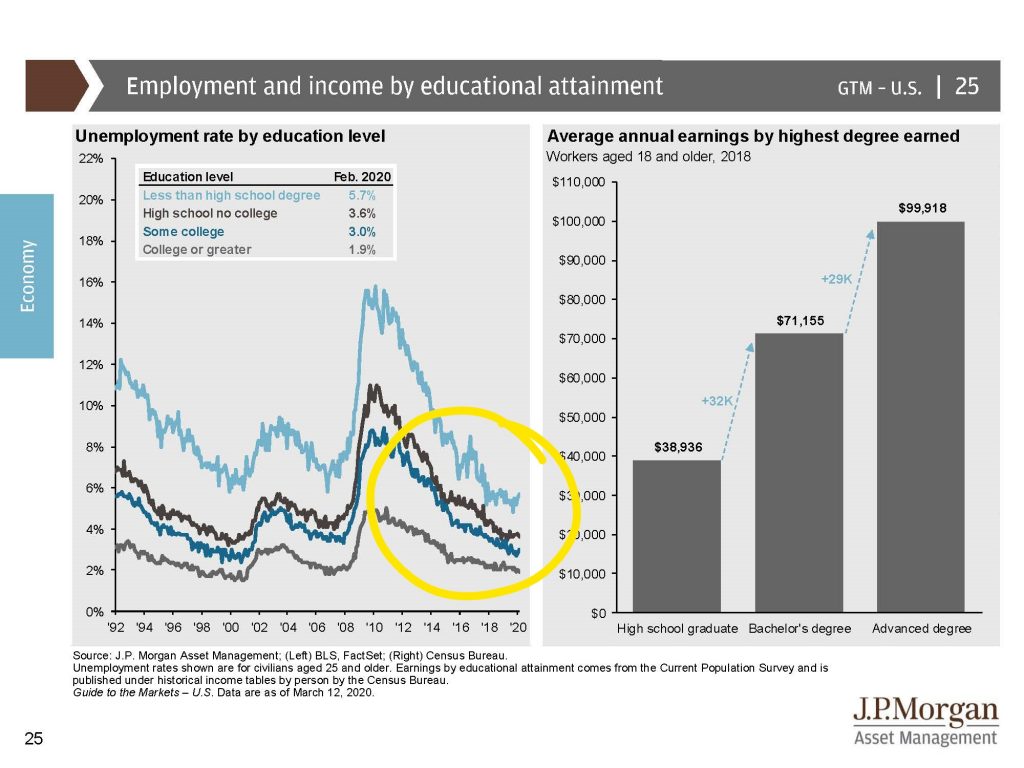
So far this year we’ve had a very dramatic three weeks. That does not, of course, mean that the entire year is for naught. This is a little bit different than 2008 for the simple fact that we started the year in a very high economic and positive nature. Unemployment – I’m going to put a graph up on the screen and what you will see is that unemployment was at an all time low and we had incredible labor force participation with wages rising in the last year or so. Just absolutely wonderful.
This is not a financial crisis. This is a healthcare crisis. Healthcare crises we’ve had before. This is a particularly bad one. We have survived the SARS. We’ve survived some of the other, the Ebola scare and other things in the last 10 to 20 years. But we haven’t seen anything like this and particularly the concern and the scare. I’m not an expert on how this crisis will play out as it relates from a healthcare point of view. There’s enough experts on Facebook that you can watch who are all your friends who used to be experts in something else. Now they’re experts in this. I admit that I don’t know and I know that there are many scientists who admit that they don’t know as well. They have models which are projections which might have some degree of probability, but this is a healthcare crisis, not a financial crisis.
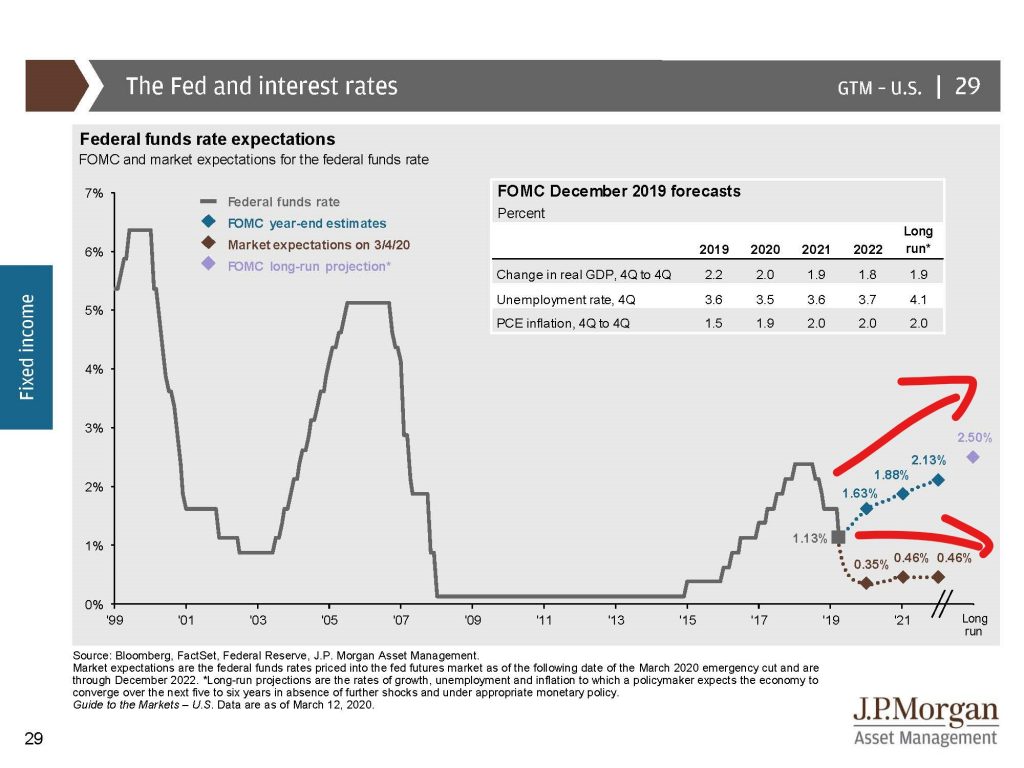
Our banks were not in a strong position back in 2007 and 2008. Now they are in a very good position on strong holding. I’m going to put a chart up on the screen.What you’re going to see is interest rates. The Fed and interest rates are very high. Sorry, are very low. And the projected, that one higher number was what they projected that they would raise interest rates. Now it has been adjusted so that we will have some interest rate declines which is a good thing. That pumps money into the economy. This is a good thing. It will help governments, consumers and corporations refinance debt with lower debt burdens with those sectors of the economy.
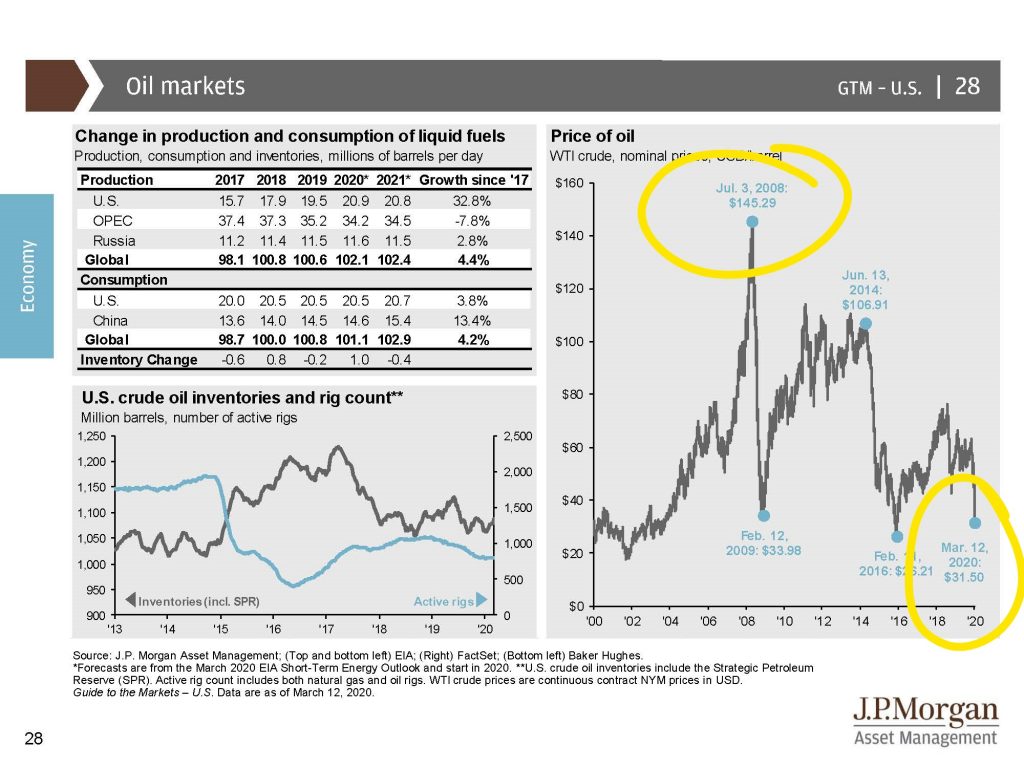
I’m going to put up on the screen another chart which is oil prices. You’re going to see a collapsing of oil prices which is effectively a big tax cut for consumers and companies that are heavy energy users like airlines and things of that nature. This is bad for oil producers. There’s going to be winners and losers in pretty much anything that happens in the economy, but this is a “huge tax cut” if you want to say. I’m doing air quotes if you’re watching the video for the consumer. And so this is a good thing unlike what the price was back in 2008 which was significantly higher than what it is today.
The U.S. has the highest – I’m going to throw another chart up on the screen. We are less dependent than many other countries on our imports and exports. I’m going to put up on the screen a list of all the companies, their imports and their exports as a percentage of their GPD. So that means that as a percentage of what they produce when you add up all the goods and services within a country what percentage of imports and exports as a percentage of what they produce both like I said goods and services. You’re going to see that when we flip through that first screen and a second screen you’re going to see I’ve just highlighted what the world average is. The U.S. is near the very bottom. That is because we are actually a pretty well contained goods and services producer and user. There are many countries that are in a world of hurt if the global imports and exports and trade dramatically change. We’re at the very, very bottom and in comparison to the rest of the world that is a good thing. It is not however, good for us because we are, I mean completely good for us. Everything is relative. When the global economy slows down we slow down as well.
SEE LIST OF COUNTRIES BY TRADE
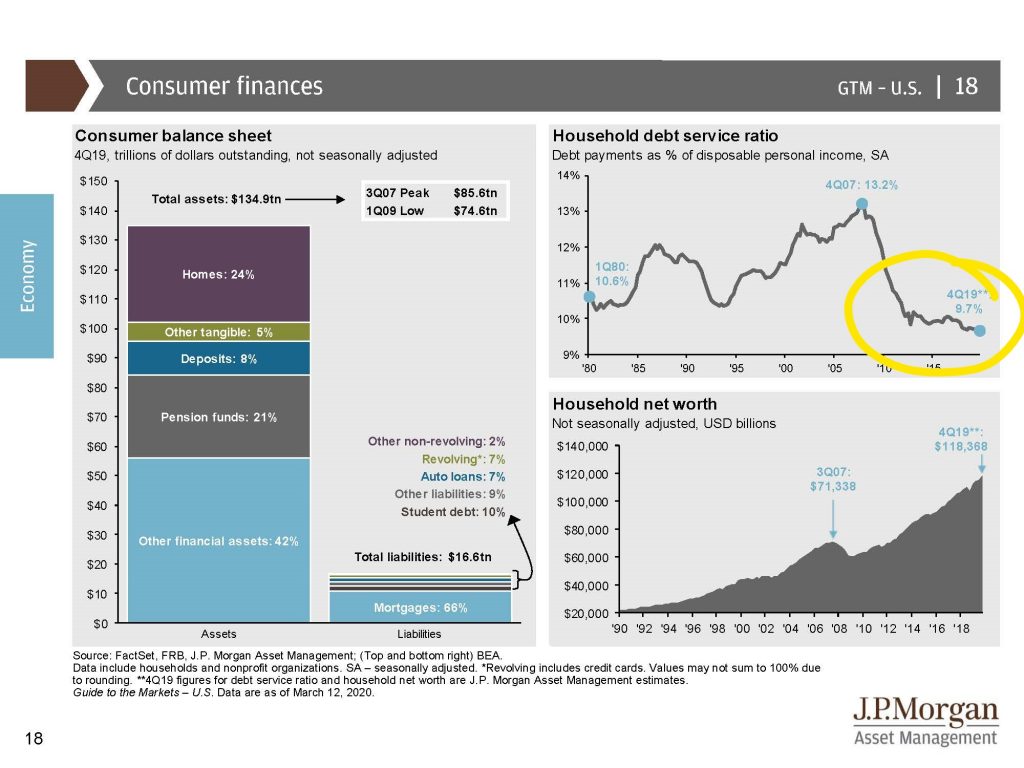
And I am just as worried about our local businesses. We’ve talked about the health of our citizens, our fellow man, our fellow woman, our fellow person and we should be concerned about that. Don’t get me wrong. But just as concerning to me are those people who are from an economic point of view more vulnerable than others. Not all of us can work at home. I mean I’m very fortunate that I get to. I’m in a white collar job. There’s an awful lot of blue collar people out there. Your servers, people who are in the service industry or in manufacturing that you can’t work from home. We should be worried about them as well. And so from a good point of view today versus where we were back in 2008, the consumer debt is much, much lower.
I’ve got the screen here and I’m going to put it up on the screen. The consumer debt is significantly lower. I’m going to put it up there on the screen and what you’re going to see is consumer debt is significantly lower than where it was. Household debt service is at 9.7 and not at 13.2 where it was back in 2007 and 2008. This is a good thing that we have much less debt from a consumer point of view than where we were back in 2008.
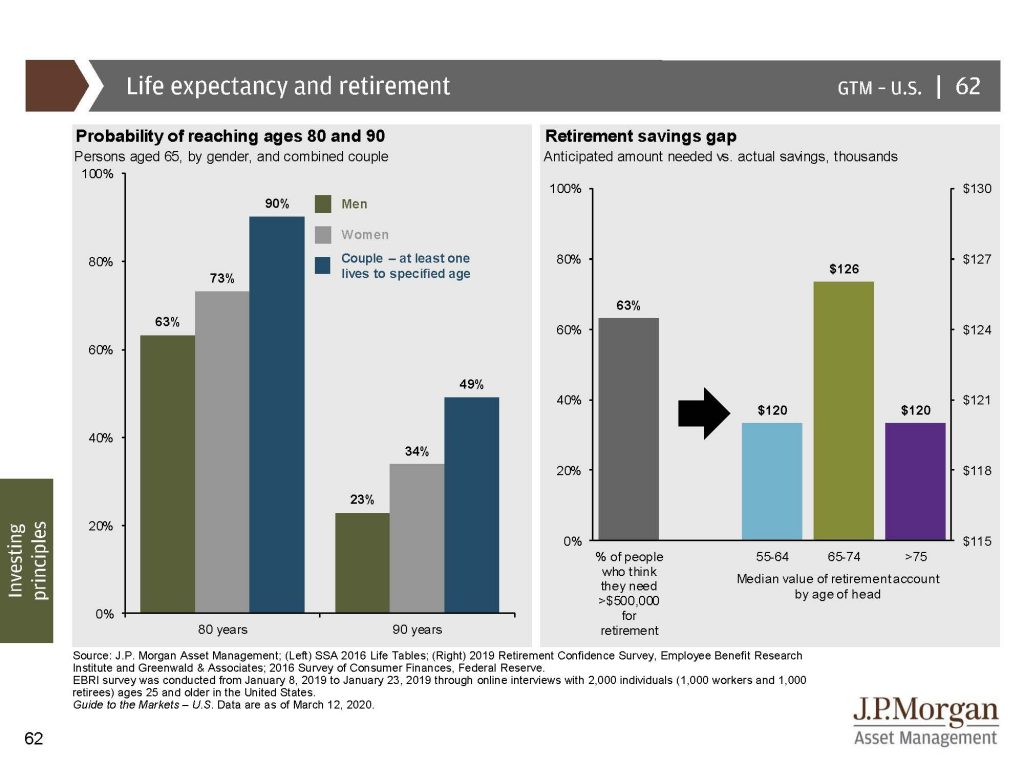
I was having a conversation with someone at my particular gym, my dojo, and they were talking about hey, wait a second. I’m in my 60s, I’m in my 70s. Will I have enough time, we talk about the longevity in the markets and the answer is I would hope so. I’m going to put up on the screen and particularly on the left side is the probability of reaching ages 80 and 90. If you are 65 years old you still have, particularly if you’re a couple, you have a 90 percent probability that one of you will reach age 80. You have a 50 percent probability that you will reach age 90. Yes, five and ten year time horizons even if you’re 75 and 80, particularly if you’re a couple. Now let’s say that you’re single. I would hope that you’re not going to die next year or the year after. Longevity is still something that you have to keep in mind. And so just throwing it into a mattress, throwing it into a money market or a savings account will almost guarantee you that you won’t reach some of your goals if you need income from it. And so we need to watch out for the longevity. We don’t know. Every person is individual in their particular portfolio and that’s why when I throw a word guarantee it’s if you have a certain rate of return that you have to achieve then there’s a balance between having the safety that you desire by not participating in something and then, of course, along that spectrum of where can I stay with my particular plan and reach those percentage rates of return that I’m hoping from the long term. And we’ve got to be in this for the long term.
There’s a quote that I read in an article and I want to make sure that I get it right. “Bear markets are periods when stocks are transferred from weak to strong hands as does wealth when recoveries occur. We’ve recovered from every past crisis which we tend to experience with great frequency about every two or three years there’s something that causes some dis-ease and right now there is some and a lot, but we too will recover from this.”
Mike Brady. Generosity Wealth Management, 303-747-6455. Give me a call at any time. Thank you. Bye bye.
