Oct 16, 2014 | Behavioral Finance, Bonds, Financial Planning, Market Commentary, Videos
As volatility has increased in the past 3 weeks, I want to keep you well informed of my thoughts.
Are the past weeks normal, have the fundamentals changed, or is this the canary in the coal mine we’ve been waiting for?
These questions are answered in my video.
Hi, Mike Brady here with Generosity Wealth Management, a comprehensive, full service wealth management firm, headquartered right here in Boulder, Colorado.
I last spoke to you a couple of weeks ago and at that time, I talked about the third quarter. I said it’s been a tough quarter, very volatile and it was down. We’ve taken some steps back as it relates to the unmanaged stock market indexes. So far this quarter in the last couple of weeks, that has continued on the downside. Nobody ever minds volatility on the upside. One thing that’s interesting is over the last 25 years the daily average of volatility has been 0.77%, about eight-tenths of 1% on a daily basis. So far this year for the first half of this year, it was a half of 1%. It was kind of the average volatility on a daily basis. One of the reasons why the last two to three weeks seems so alarming is because the volatility has been over 1% so it’s two to three times what we’ve been kind of lulled into feeling the first half of this year and also what is normal when we look back over a 25-year timeframe. Two weeks ago, I mentioned that the smart money looks at the data and what’s happening now and says okay, so how far out an outlier is this? Is this something that actually happens quite often or periodically and that it’s a part of the game investing, part of what we should expect or is this is a precursor to something much more deadly? Are the fundamentals telling us that this is an early canary in the coal mine of some bad that’s going to happen? My answer is the first, not the latter, in that this is actually normal even if it is painful, a part of the process. When we look at a longer time horizon which is what sort of the smart money should do is looking at it from where does this fit in one year, five year, 10 year and even longer than that.
I’m going to throw up on the graph there up on your screen there, looking back over a 17-year time horizon for the S&P 500 which is an unmanaged stock market index and this is as of September 30. I’m going to put a little red mark where we are right now just to give it some perspective. I’m doing this Tuesday night so I know exactly what our closing number was and hopefully you’re getting this on Wednesday or Thursday. You can kind of see that in the whole scheme of things we could have said at that other line that I just put in there, yeah, you can see it’s a pop. It’s not going to go any higher and then we could have done it all the way from that bottom arrow all the way to where we are today. We could have said, oh my gosh, this is a high, it can never go any higher.
I’m going to put on the screen now a second graph which is looking back 114 years. You can see that there are consolidation periods and then there are times of advance, consolidation periods of times of advance. You can see there and I’ve just circled it where I believe that we are. I actually believe that we are on a longer-term advanced than we are in consolidation or a decline. Other people can make an argument to the downside; that’s okay. We always joke that economists have predicted 17 of the last the last three recessions so that’s an easy thing to do. The hard thing is for me to try to be as straightforward with you and say this is a part of that long-term process. As a matter of fact, our emotions have a tendency want to react in the wrong way. I’m going to throw a chart up on the screen there. You can see that in the late 90s, consumer confidence was at an absolute high, but that was the worst time to buy. Okay? Now you’re going to see back in the beginning of ’09 which was the beginning of that huge upswing that I showed you in the first graph that consumer confidence was a low. Then two years ago right before last year’s really strong stock market gain, consumer confidence was once again at a low. It’s almost contrary of what you would think. Like oh, people are feeling all negative so the market must go down negative. No, it’s quite the opposite. In fact, kind of what we call a lagging indicator where people actually do the wrong thing at the wrong time.
The next graph that I want to show you is up on that screen there. I think this absolutely essential. What you are going to see is those red numbers at the bottom are the intra-year decline. What that means is if the market was up 10% and then it drops 7% and at the end of the year at 3% or maybe it even ended at a different number, the high to the low throughout that year is normally a seven, eight, nine, 10, sometimes double digits so it is normal for there to be corrections within the year. It does not mean the year will end that way. I think that’s absolutely essential for us to keep in mind because we do take five steps forward at times and four steps back. If we believe that in the future that the market will be higher than where it is today, that’s why we have investments. If we didn’t believe that, why would we have investments? Keep it in your mattress, keep it in the bank. That makes no sense if you believe that long term the market is going to be lower than it is today over long term. I think that’s not a very wise bet.
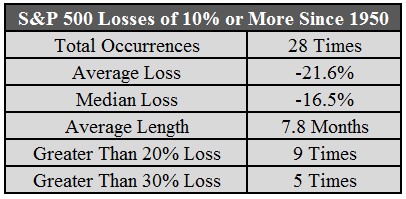
I’m going to throw another chart on the screen; it’s a table. The reason why I throw this up there is because there is a well, you know, it’s just like the 1990s or it’s ‘07. Let me just tell you, look at the price to earnings ratio of about 15%. It was double that back in the late ‘90s. I mean from a valuation point of view, we’re nowhere near where we were in previous times when we’ve had a huge decline. We have lots of cash, a huge profitability, leveraging is down so this is a very good thing and the fundamentals I feel are still strong.
This last graph I want to show you I think is very, very important and that it shows historical returns by holding period. What you’re going to see is that on a yearly basis, that’s the one on the far left-hand side, there is a huge variance. The left one is 100% stock, unmanaged stock market index. The next one is 100% bond index and then there is a mix of the two together. With the one year, there is a huge variance. That’s just the way things work. Once we look out five years, 10 years, even 20 years that variance, that kind of expected return or that highs and lows have a tendency to kind of, the highs go lower and the lows go higher. For a 50/50 split historically, of course it could be different in the future, there actually has never been a five-year timeframe when the worst you’ve done is make 1% a year. Moving out to cash, thinking that you’re going to try to outsmart everyone else, that you are reading the headlines and you have some supposition of about what’s going to happen in the future I think is not very wise.
The very last thing I want to show before I cut this video is the benefits of having a stock and a bond mixed together. You’ve seen me do this before even with my hand. Up on the screen there is the 10-year Treasury note yield. It’s declined which is a good thing. The yield goes down when the price goes up. You can see that there is actually huge volatility in the last year. Those arrows there are in the last kind of year-to-date. This has been a great year to have bonds. In hindsight, having 100% of your portfolio in bonds would’ve been a fine thing to do. We don’t know hindsight so that’s why we have a mix of stocks and bonds and of course that mixture depends on the client what’s appropriate. Of course, having a well-diversified portfolio does not guarantee against declines in a general declining market, but I do believe that it is the wise way to go going forward. You can see that in the last month or so as the stock market has rarely gone down that the bonds have actually gone up. Once again, we know that because the graph went down which is counter-intuitive, but it actually meant that bonds went up so this is a good thing for bonds when the graph looks on the downside from left to right like that.
That’s what I have for right now today. I’m going to continue with these updates to you, my clients and to my friends and prospects, prospective clients. I’m here if there are any concerns that you have, 303-747-6455. Investments are a part of the big picture of getting you to where you want to go with your goals, etc., but I’m not overly freaked out about where things are at this point. Hey, would I wish that things were higher? Of course, of course, but do I over react and scrap my plan based on some weeks and months of data? Absolutely not and you shouldn’t either.
Mike Brady, Generosity Wealth Management, 303-747-6455. You have a great day, see you, bye-bye.
Oct 4, 2014 | Estate Planning, Financial Planning, Market Commentary, Videos
The 3rd Quarter was schizophrenic, with most of the unmanaged US and international stock indexes negative, bonds (in general) slightly positive, and with tons of volatility across the board.
Particularly in the past few weeks, every day there seems to be triple digit swings in the Dow, and lots of negative news (ISIS, Ebola, etc.).
Now is the time when we have to remember the big picture and what we as investors are striving towards. It is the time when emotions can be high, but we need to keep a steady hand and focus. Now is when we reaffirm what our goals are and whether information that we’re being given is something to be alarmed about, or the normal course of a market.
I address these “big picture” issues in my video this week.
Transcript:
Hi there. Mike Brady with Generosity Wealth Management, a comprehensive full-service wealth management company headquartered right here in Boulder, Colorado.
Today I want to talk about where we are so far this year, of course including the third quarter of 2014, and also the next quarter where we are presently. Let me expand a little bit into the next 18 months or so, but before I do all of that I want to kind of look at the big picture. For us to examine why it is that we’re even doing this.
I like to think of investing as taking three steps forward, two steps back; or four steps forward, three steps back. There are people who will say – no, no, no; I have this wonderful program that’s really exciting, it’s sexy and it’s very tantalizing to say, but we know that that’s bad. If we look at all the particular investments that are out there they always have some kind of a jagged edge, meaning that they go up and they get some down, and then go up, and get some down. That’s a part of it. It’s part of this stuff that I was talking about – four steps forward, three steps back. The time that there are steps backwards it’s so uncomfortable and if you are so focused on that then you’ll never have the joy of the steps forward. Those steps back might be one quarter, might be one year, might be a couple of years. Historically in just the last 15 years or so, year 2000, 2001, 2002; those were three down years right in a row; 2008 was a very painful down year and 2011 we had a really painful third quarter of that year, but in general it was pretty much just a breakeven year in general. The last four, five, even six years or so, not counting 2008, but since 2008 we’ve had a generally trending up market. That’s not always the case. This is nice that we’ve had these steps forward and relatively few steps backwards. As a matter of fact, it’s so unusual right now that when it happens we start to get concerned. We’re like – Oh my gosh, this is Armageddon. It’s good for us to sit back, relax and say – okay, is this new information?, is this new data relevant enough that it changes my perspective?, that wow, it’s such a headwind that I don’t think I’m going to be able to go forward anymore like I have been able to, or is this just static?, is this just chaos out there that’s normal for the market?
I’m going to jump right to the conclusion and tell you that I think it’s the latter. We have enjoyed a relatively calm situation the last five to six years. Any kind of a disruption of the Dow, 100, 200, 250 or so; that has been happening since the Dow was at 10,000 and 11,000 and 12,000 and 13,000 and now it’s in the 16,000 and 17,000 range and all along the way there were people who were saying – no, it can’t get any higher, well, we’re always at a high, it’s going to go down, etc. That’s not necessarily the case. Why else would we be invested in the market if we didn’t believe that sometime in the future it’s going to be higher than it is today. If we didn’t believe that, than we should just keep our money in a safe, or the mattress, or someplace else where we can have absolutely no principal loss. What we can do as investors is really watch our emotions and be the smart money (I’m going to put my quotes up there), the smart money because emotions cause your average investor, I would even say some of your professional investors to do the wrong things at the wrong time. When we look at money flows in and out of the market you’ll notice that 1999 everyone was so ecstatic. I mean emotions were so very high on the technology and so much money was going in basically at a high. At the end of 2008, the beginning of 2009 as we look at the market that was actually the perfect time to buy, but nobody wanted to buy at those points. Everybody was rushing to the door when really they were selling at the bottom and real people unfortunately buy at the top, which is what we don’t want to do. That’s why it’s good for us to keep a long-term vision of what’s going on and not be too distracted by the day-to-day, I would even say the month and the quarterly numbers and have good managers, good goals, a good plan that takes into consideration macro events and stick to that.
Sometimes the most difficult thing to do is actually do nothing, or to not overreact. It’s sort of like if you are in a car and you’re on some icy road and you’re trying to get to a certain destination, the wind is blowing you left and right, a real experienced driver is not going to overcorrect one way or the other. Yes, there’s going to be minor corrections. Yes, you are going to be very diligent in how you get to that destination down the road, but you are also going to understand – hey, wait a second, this gust is just happening. It’s going to go away and I believe that by not overreacting I’m actually long-term going to be better for myself.
This is what my 23 years of experience has shown me is that we watch out for some of the kind of sexy things that could be out there. I’ve got to tell you I’ve sometimes been real enticed by a promise of the highest return out there with no volatility. I’ve seen these things and I just don’t believe that they’re right for my clients and particularly at this particular moment in time. A good composition of stock funds, bond funds, cash, a smattering of potentially some non-traded REITs may have a place for a client if it makes sense. Of course, don’t do anything until you either talk with me, or if you’re my client to see if it made sense. This is very, very broad that I’m talking about. I really like some Business Development Companies, BDCs that are out there that can add some extra yields as well. One statistic that I do want to throw out there is just to kind of give an example of the environment that we’re in, is back in 2007, October of 2007, the yield on a bond was such that if you needed $1000 worth of income, how much do you think you would have to invest in order to get that $1000? About $24,000. What about five years later, in 2012, October. To get that same $1000 worth of income, how much money would you have to be invested in? — $3.3 million is the answer. It’s so big because the yield went from 4% all the way down to practically zero, literally almost zero.
When we look at all the various options out there in order to make money. There are bonds out there. There’s real estate. There are stock investments, etc. If you’re looking for a perfect answer, there simply isn’t one. One of the parts of I think adult life is understanding that there are many times imperfect choices. We see this every time we go to the polls for an election. No politician, no party (in my belief, maybe you think differently) is perfect. There’s always something that you disagree with them about. Therefore, we’re picking the best of our options that are available to us. Well, it’s the same way from an investing point of view. You’ve got your bonds. You’ve got your stocks. You’ve got your cash. You’ve got your real estate. You’ve got your alternatives, etc. and each one has pros and cons and it’s determining which one is right for you. The yield that you are getting on bonds, very, very low, but I think it’s part of a portfolio of a diversified portfolio. The yields on CDs and money market are down to practically nothing. As we’re invested in the stock market for the long run, one of the things that comes with that, one of the disadvantages is a little bit more volatility. We don’t have a guarantee of principal, so we’ve got to be smart; we’ve got to be diversified. Although that doesn’t guarantee in a generally trending down market that you won’t experience some losses, but we want to be diversified in order to tamper down some of that volatility.
As I started out the video talking about taking four steps forward and three steps back. Well, if you want to run and take 10 steps forward up, that’s okay. You just take the risk of sometimes taking nine steps backwards. That’s not necessarily what everyone ought to do and I think I want to bring some realism into what our expectations should be.
Warren Buffet, one of the most successful managers out there, over time he had averaged a little over 8% per year. For us to expect in the teens or in the 20s every single year is an unrealistic expectation and you will be disappointed and might cause you to do the wrong thing, which is to try to chase something or someone who is going to promise you something that long-term isn’t going to last. While Warren Buffet was making that 8% return he had time. Just in the last 20, 25 years we had 50% declines to you and so I think that that’s a very uncomfortable situation. I personally don’t want to position myself with client portfolios where we have that kind of volatility and so I think by having a good diversified portfolio with good managers long-term, we can hopefully start to narrow that band of – and unfortunately sometime giving up some of those high-highs to getting some of the low-lows as well. So far this year markets are plus or minus a few percent depending on what stock market index you want to look at. The bond market is positive for this year. I think going out 18 months we will continue to have a good market. When I look at the yield curve, which is still a normal yield curve, which is great, it’s not inverted. I’m going to throw up some graphs up on there as well. When I look at where we are from a quantitative easing that has been easing off and will continue to go down to zero. I’ve been actually surprised we haven’t had more reaction to it. When we look at the fundamentals, the fundamentals are so strong. Huge cash balances which are wonderful from the balance sheets of corporations point of view. I think that the fundamentals have not changed in three or four months. Yes, things are slowing down a little bit. I don’t want to sit here and say that everything is wonderful. I want to make sure that I don’t give the impression of being Pollyannaish and saying everything is perfect and wonderful out there. If you’re looking for a perfect world, if you are ever looking for the perfect storm in a positive direction, you are never going to get it. You are going to be disappointed every single time. Therefore, we have to look it and say on balance is there 51% more good than negative, and if that’s the case then we adjust accordingly, and we say, yeah we’re optimistic for the next quarter and maybe even the next 18 months.
I’m always open to feedback. I’m always open to a different point of view. Please give me a call if you would like.
One thing to watch out for is that we don’t get so negative that we have these scenarios that we’re afraid to move forward and some things that might be volatile that are not certain, but then we put ourselves in such a situation where we want a warm fuzzy blanket and it costs us an awful lot for that. Anything is possible out there. The question is what’s the probability? I really deal with probabilities more than I do even possibilities, and yes there’s always those curves and those black swans, etc. One of the reasons why they call it black swans is they’re so, so very unique and yet they can be devastating, but we can’t live our lives by only focusing on the absolute worst that can happen. We have to prepare ourselves for that, but we also have to live within what’s probably out there.
Mike Brady, Generosity Wealth Management, 303-747-6455. You have a wonderful day. Thanks.