I was recently asked to be on an hour long radio show / podcost talking about ethics in the workplace.
It was titled “Navigating the Demands of Business and Remaining True to Yourself”.
It was lot of fun, and the host was really engaged and enthusiastic. While he and I talk about the demands of business and how being ethical is so important, I share my life story with him, which many of you know. I am pretty open with him (as I am with everyone who is interested), sharing the ups and downs of my personal and business life.
If you want to learn more about your advisor, click on the link to listen to it within your browser, and I’ve also transcribed it and posted it for reading.
Warren Buffett “Never Invest in a Business You Cannot Understand”
Good advice.
I’m going to take it one step further and say “something” or “anything”.
I think Wall Street has created a lot of very creative financial products out there, and some of them are good while others are bad. Mostly it depends on which “tool” you need to meet your individual goals.
That being said, just because something is complicated doesn’t mean it’s better, and you should definitely understand it before investing in it.
That’s one of the jobs of your financial adviser, to help explain each investment you have, how it fits into the big picture, and the pros/cons of each one. Before you invest, be sure your questions are answered fully so you have confidence you’re making the right move!
It’s definitely something I live by, and I never recommend something to a client without full due diligence.
I did financial plans for people decades ago, and usually, those that did reach their goals did so not because they bought mutual fund A instead of mutual fund B, or this investment over another, it had to do with having the right behavior and keeping the big questions in mind.
Ben Carlson wrote an absolutely wonderful blog that I’ve linked to below. He says very succinctly what I say all the time, and truly believe.
Here’s his list of 7 Simple Things Most Investors Don’t Do
Look at everything from an overall portfolio perspective
Understand the importance of asset allocation
Calculate investment performance
Save more every year
Focus only on what you control
Delay gratification
These are absolutely right on, and reflect my thinking.
As volatility has increased in the past 3 weeks, I want to keep you well informed of my thoughts.
Are the past weeks normal, have the fundamentals changed, or is this the canary in the coal mine we’ve been waiting for?
These questions are answered in my video.
Hi, Mike Brady here with Generosity Wealth Management, a comprehensive, full service wealth management firm, headquartered right here in Boulder, Colorado.
I last spoke to you a couple of weeks ago and at that time, I talked about the third quarter. I said it’s been a tough quarter, very volatile and it was down. We’ve taken some steps back as it relates to the unmanaged stock market indexes. So far this quarter in the last couple of weeks, that has continued on the downside. Nobody ever minds volatility on the upside. One thing that’s interesting is over the last 25 years the daily average of volatility has been 0.77%, about eight-tenths of 1% on a daily basis. So far this year for the first half of this year, it was a half of 1%. It was kind of the average volatility on a daily basis. One of the reasons why the last two to three weeks seems so alarming is because the volatility has been over 1% so it’s two to three times what we’ve been kind of lulled into feeling the first half of this year and also what is normal when we look back over a 25-year timeframe. Two weeks ago, I mentioned that the smart money looks at the data and what’s happening now and says okay, so how far out an outlier is this? Is this something that actually happens quite often or periodically and that it’s a part of the game investing, part of what we should expect or is this is a precursor to something much more deadly? Are the fundamentals telling us that this is an early canary in the coal mine of some bad that’s going to happen? My answer is the first, not the latter, in that this is actually normal even if it is painful, a part of the process. When we look at a longer time horizon which is what sort of the smart money should do is looking at it from where does this fit in one year, five year, 10 year and even longer than that.
I’m going to throw up on the graph there up on your screen there, looking back over a 17-year time horizon for the S&P 500 which is an unmanaged stock market index and this is as of September 30. I’m going to put a little red mark where we are right now just to give it some perspective. I’m doing this Tuesday night so I know exactly what our closing number was and hopefully you’re getting this on Wednesday or Thursday. You can kind of see that in the whole scheme of things we could have said at that other line that I just put in there, yeah, you can see it’s a pop. It’s not going to go any higher and then we could have done it all the way from that bottom arrow all the way to where we are today. We could have said, oh my gosh, this is a high, it can never go any higher.
I’m going to put on the screen now a second graph which is looking back 114 years. You can see that there are consolidation periods and then there are times of advance, consolidation periods of times of advance. You can see there and I’ve just circled it where I believe that we are. I actually believe that we are on a longer-term advanced than we are in consolidation or a decline. Other people can make an argument to the downside; that’s okay. We always joke that economists have predicted 17 of the last the last three recessions so that’s an easy thing to do. The hard thing is for me to try to be as straightforward with you and say this is a part of that long-term process. As a matter of fact, our emotions have a tendency want to react in the wrong way. I’m going to throw a chart up on the screen there. You can see that in the late 90s, consumer confidence was at an absolute high, but that was the worst time to buy. Okay? Now you’re going to see back in the beginning of ’09 which was the beginning of that huge upswing that I showed you in the first graph that consumer confidence was a low. Then two years ago right before last year’s really strong stock market gain, consumer confidence was once again at a low. It’s almost contrary of what you would think. Like oh, people are feeling all negative so the market must go down negative. No, it’s quite the opposite. In fact, kind of what we call a lagging indicator where people actually do the wrong thing at the wrong time.
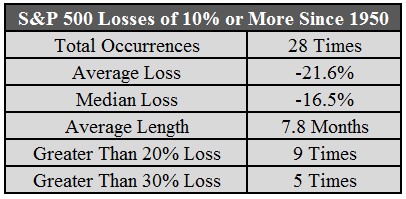
The next graph that I want to show you is up on that screen there. I think this absolutely essential. What you are going to see is those red numbers at the bottom are the intra-year decline. What that means is if the market was up 10% and then it drops 7% and at the end of the year at 3% or maybe it even ended at a different number, the high to the low throughout that year is normally a seven, eight, nine, 10, sometimes double digits so it is normal for there to be corrections within the year. It does not mean the year will end that way. I think that’s absolutely essential for us to keep in mind because we do take five steps forward at times and four steps back. If we believe that in the future that the market will be higher than where it is today, that’s why we have investments. If we didn’t believe that, why would we have investments? Keep it in your mattress, keep it in the bank. That makes no sense if you believe that long term the market is going to be lower than it is today over long term. I think that’s not a very wise bet.
I’m going to throw another chart on the screen; it’s a table. The reason why I throw this up there is because there is a well, you know, it’s just like the 1990s or it’s ‘07. Let me just tell you, look at the price to earnings ratio of about 15%. It was double that back in the late ‘90s. I mean from a valuation point of view, we’re nowhere near where we were in previous times when we’ve had a huge decline. We have lots of cash, a huge profitability, leveraging is down so this is a very good thing and the fundamentals I feel are still strong.
This last graph I want to show you I think is very, very important and that it shows historical returns by holding period. What you’re going to see is that on a yearly basis, that’s the one on the far left-hand side, there is a huge variance. The left one is 100% stock, unmanaged stock market index. The next one is 100% bond index and then there is a mix of the two together. With the one year, there is a huge variance. That’s just the way things work. Once we look out five years, 10 years, even 20 years that variance, that kind of expected return or that highs and lows have a tendency to kind of, the highs go lower and the lows go higher. For a 50/50 split historically, of course it could be different in the future, there actually has never been a five-year timeframe when the worst you’ve done is make 1% a year. Moving out to cash, thinking that you’re going to try to outsmart everyone else, that you are reading the headlines and you have some supposition of about what’s going to happen in the future I think is not very wise.
The very last thing I want to show before I cut this video is the benefits of having a stock and a bond mixed together. You’ve seen me do this before even with my hand. Up on the screen there is the 10-year Treasury note yield. It’s declined which is a good thing. The yield goes down when the price goes up. You can see that there is actually huge volatility in the last year. Those arrows there are in the last kind of year-to-date. This has been a great year to have bonds. In hindsight, having 100% of your portfolio in bonds would’ve been a fine thing to do. We don’t know hindsight so that’s why we have a mix of stocks and bonds and of course that mixture depends on the client what’s appropriate. Of course, having a well-diversified portfolio does not guarantee against declines in a general declining market, but I do believe that it is the wise way to go going forward. You can see that in the last month or so as the stock market has rarely gone down that the bonds have actually gone up. Once again, we know that because the graph went down which is counter-intuitive, but it actually meant that bonds went up so this is a good thing for bonds when the graph looks on the downside from left to right like that.
That’s what I have for right now today. I’m going to continue with these updates to you, my clients and to my friends and prospects, prospective clients. I’m here if there are any concerns that you have, 303-747-6455. Investments are a part of the big picture of getting you to where you want to go with your goals, etc., but I’m not overly freaked out about where things are at this point. Hey, would I wish that things were higher? Of course, of course, but do I over react and scrap my plan based on some weeks and months of data? Absolutely not and you shouldn’t either.
Mike Brady, Generosity Wealth Management, 303-747-6455. You have a great day, see you, bye-bye.