We’re all under strict stay-at-home restrictions now and trying to make predictions about an unpredictable situation, which is impossible. In today’s video we take a look at what we are seeing in the market and the economic factors at play; when we might see a rebound and; why we are seeing such a strong impact as a result of an unprecedented health situation.
As you watch, I want you to remember what I say in every video, please stay calm and let’s do our best to look towards the horizon and keep our eyes set on better days.
Hi there. Mike Brady with Generosity Wealth Management, a comprehensive, full service financial services firm headquartered right here in Boulder, Colorado.
As you can see from the backdrop I am under a stay at home order just like you are so I’m recording this from my home office. This is my ninth video in the last two months because there’s been an awful lot going on. I’m recording this on Sunday, March 29, in the afternoon. Normally I wait until the quarter is over to record the video and get the newsletter out to you but frankly, I want to be a couple of days in advance so that I have the recording and the video so that I can get it out to you right away as the quarter ends.
I want to talk today about what, why and when. Before I do that I just want to share with you a personal anecdote about some of my current thoughts not related necessarily to the market. I’ve only been out two times in the last week and both times have been to a restaurant. There’s a number of restaurants that I like here in Boulder and I want them to do well. While I have lots of food here at home I want to go out and support them so I’ve gone and picked up my food from the takeaway. When I go in there it’s just really sad. I go in and all the chairs are up and in both restaurants all the tables were pushed to the side. I’m not sure if they’re doing deep cleaning or what they are, but it was just so very sad. Boulder is completely empty. When I see the photos of New York City and some of the other big cities – San Francisco, Los Angeles, et cetera, it just really makes me sad and it’s just a bizarre time that we’re living in.
But what it does also do is remind me of all the goodness that is in my life. The fact that I can stay at home and have a wonderful place in the mountains of North Boulder with a wife and dog that I love and I’m safe. I don’t have to worry about that. Most of the people that I associate with, the fact that my clients are doing well, I know because frankly, I have a small microcosm. To be my client you have to be either on your way to reaching your financial goals or have reached them and want to continue to maintain them. There’s a lot of people who are not in that situation. The restaurant workers, the servers, all the blue collars, the people with only a high school degree, those with very little college. There’s a lot of people who are going to be hurt by this. The small businesses. This is just really painful and we’re not really sure how this is all going to play out going forward.
The fact that we can have a fridge full of food and a pantry is a great thing. There’s a lot of people in much of the world who don’t have that option whether you’re in India or Africa or many other places where you have to go and get food every day. I just can’t help but think about how blessed I am even in a situation that if I allow it, I allow it to get down and it gives me a little bit of perspective.
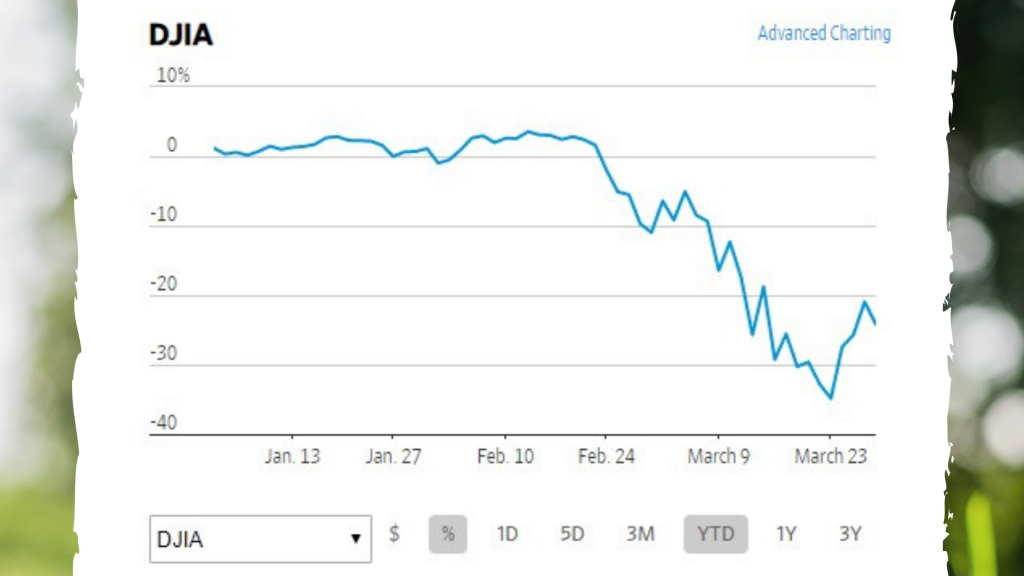
Let’s talk a little bit about the what has happened over the last couple of months. I’m going to put up on the screen a chart – the percentage change of an unmanaged stock market index, the Dow Jones industrial average. What you’re going to see is that it went significantly down since the middle of February all the way up until Monday of this past week and then it had a nice rally this past week as well. It hit a low on Monday and then by Tuesday, Wednesday, Thursday it started to come back, but it is still over 20 percent down for the year as of Sunday, March 29.
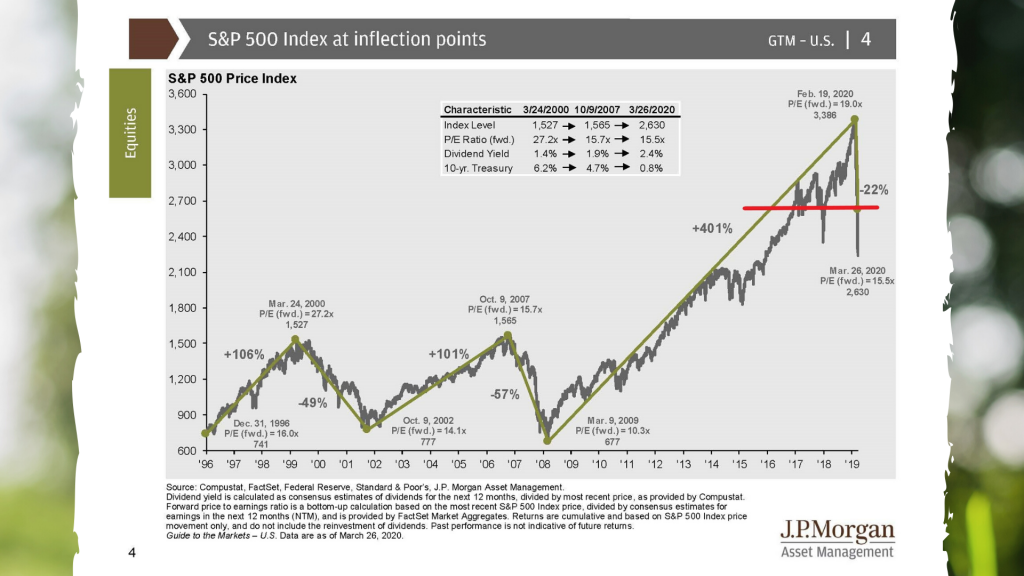
Let me put another chart up on the screen. This is the S&P 500 which is also an unmanaged stock market index. You can see that I put a line to where it is right now and that it’s given up a couple of years’ worth of gain. We worked really hard for all those gains and I’m very happy with all of the gains over the last 10 to 12 years. We’ve given up a few of those years right there as you can see. That’s the red line that we’ve got, that horizontal line.
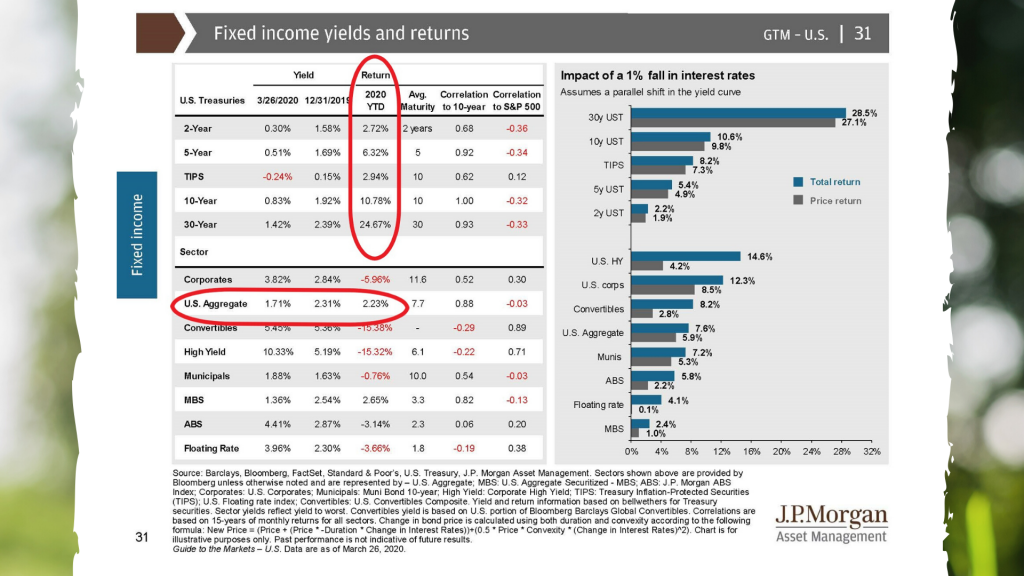
The next chart that I’m putting up on the screen are bonds and general bond indexes, unmanaged bond indexes or treasuries and various particular categories of bonds. They’re doing what they should do which is go positive when the stocks re going negative. That usually is what happens. Not always. Many times they do the same thing if everyone is rushing toward cash. They are positive for the year and a return that a diversified portfolio will have is dependent upon how much bond, stock – what that allocation is between the two. If you’re very aggressive and have a high percentage in stocks or equities then, of course, you’re going to be lower now. You were higher last year. You’re going to be lower this year. More volatile. If you had lots of bonds then, of course, last year in general a diversified portfolio was probably not as high as a stock portfolio, and it’s not as down this year. That’s really the what has happened so far this year. And this is just talking about the stock market. This is not talking about the economy because frankly, that is still to come.
Just a few days ago we had the weekly unemployment numbers and they were huge compared to 100,000 or 125,000 it was three million. Just an absolutely unprecedented number and more is to come. One of the things that I would say and I’m going to repeat this by the end of the video is I would argue that the stock market and the economy are even more complicated or at least as equally complicated with the number of variables and moving pieces as a pandemic, a virus and how that might move. Think about how many experts are giving various opinions and they’re not really sure because it’s about the future and nobody knows the future. We put a huge stock on the economy and that’s going to have some big impacts for quite some time.
Let’s talk about the why. Well, the why is this virus and the response to it. Let’s talk about what it wasn’t. It wasn’t because of an oil embargo. Quite the opposite. Oil was at an all time low. Not an all time low but the lowest we’ve seen in decades. It’s not because of a tech bubble. It’s not because of a financial crisis or real estate. No, this happened because we flipped the switch. We pretty much put a halt on much of the economy worldwide and this is something that we have not seen before. The stock market is forward thinking. The stock market is saying how is this going to impact. And sometimes we get it right and sometimes we get it wrong. Sometimes we being the stock market and investors. Sometimes there’s an overreaction, a belief that it might be worse than it is. Maybe it’s priced it in already. Time is yet to tell on this.
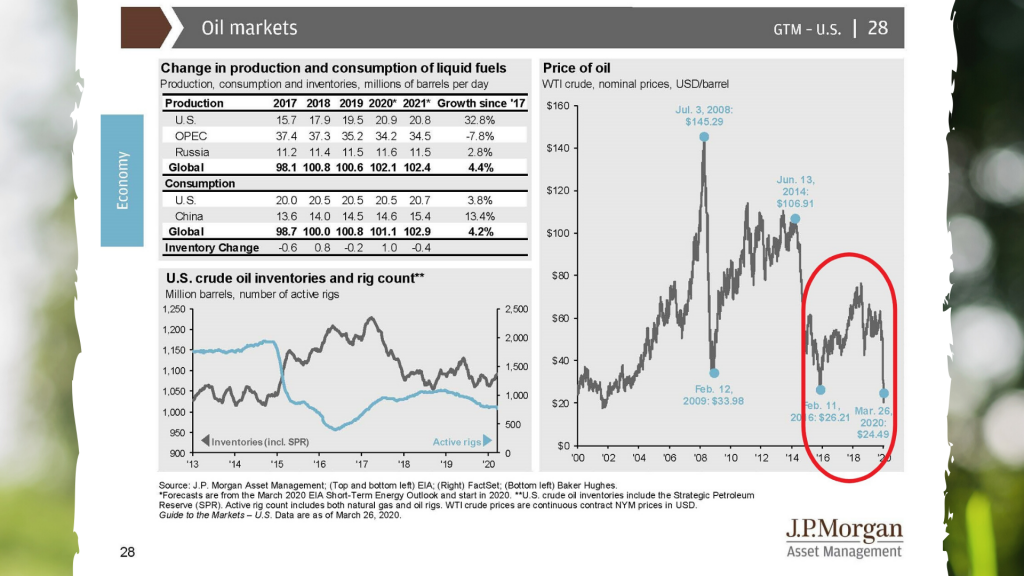
I want to put up on the screen the price of oil. You’ll see I’ve circled it. That’s what I’m talking about. On the far right hand side is the price of oil and it’s under $25 a barrel. The demand has completely dried up because we’re all staying at home. I’ve never filled up my truck as little as I have this month because I’ve only put 10 or 15 miles on it in the last two weeks. There’s also an awful lot of oil out there. This video is not about oil, but oil is at a huge decline.
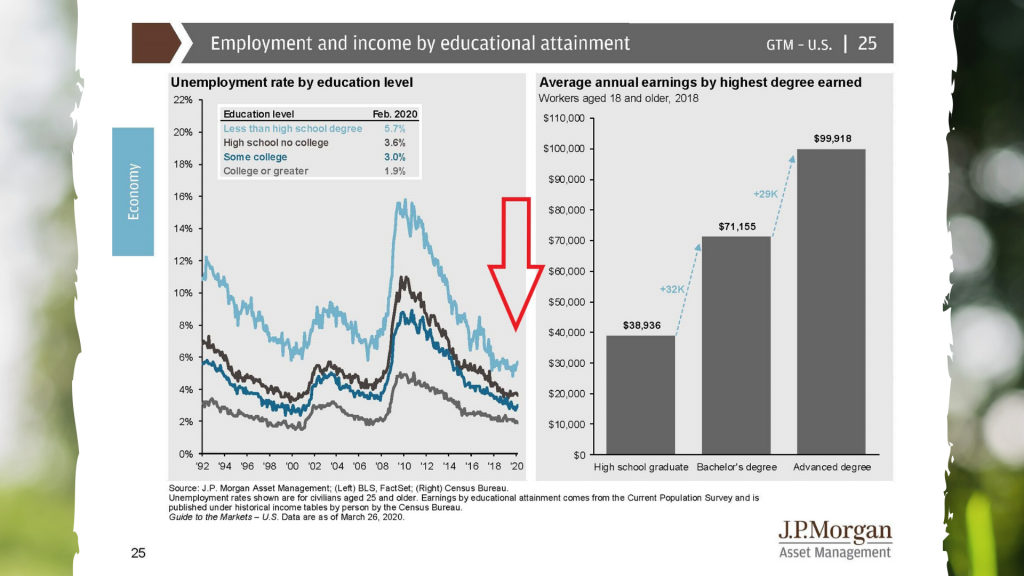
The next graph that I’ve just put up there is unemployment coming into this particular situation was also at historic lows. The top line are those without high school education and those are the ones who are going to be the hardest hit. Not everybody could just work at home. Not everybody is a white collar worker who can do something like that – a tech or other types of financial workers. A lot of people have to interact with others and those are the ones who are going to be hardest hit. It’s good for us to know why, but also why not. I mean let’s talk about before I get into the when because that’s really the big question. Coming into this situation we were actually in a pretty good spot and we still are for many companies, particularly the large corporations. When you look at Apple with over $200 billion in cash, when you have Amazon hiring over 100,000 new employees to meet demand. When you look at some of the other companies – Microsoft with over $100 billion, with Alphabet which is the parent company of Google. Much of silicon and technology and pharmaceuticals and big companies are going to come through this okay or at least they’re coming into it in a strong position unlike where things were at the last financial crisis which was 2008.
It’s really good to remember that there’s a lot of reasons to be optimistic because we came into this with a reasonable, many of those companies reasonably over the last ten years said we want to be ready for the next big shock. Some companies are ready and some aren’t. One of the things that a situation like this shows are those companies whose balance sheets are not good, and this goes from the big companies, the middle companies all the way down to the small. What we’re going to see in my opinion in many of our communities is a lot of businesses go out of business whether that’s restaurants or service businesses, et cetera. Those that were either highly leveraged with lots of debt or they have profit margins that were extremely low and they just couldn’t handle something like this. So it’s important to always have a good balance sheet and to have strength when the unexpected happens.
The big question – let me pivot now to the when because isn’t that really what we’re always talking about. If the market loses 20 percent on Monday and comes back on Tuesday, Monday night was really horrible. But most of the time people don’t mind. I mean people move on. They quickly forget. It’s really how long you are under and the longer from a stock market point of view or portfolio that you’re negative, the longer that timeframe goes, the less comfortable you become because you’re always remembering where it used to be. We call it a high water mark sort of like water in a tub. You can see the ring and where it used to be and that’s your new base for where you believe that you should be.
One thing that the stock market does is it continually gives us daily prices, and our house we don’t get daily prices because we don’t sell our house every day or other people aren’t buying exactly the same house. We might have an estimate but we don’t have daily pricing. The same thing with the economy. We do not have daily, minute, by the second pricing and so as this dribbles out over the coming months we’re going to have a better and better picture.
I remember back in 2000, 2001, 2002 all the way up to about March 2003 so it was really about March 2000 to about March 2003. It was a three year timeframe from the last big tech bubble. It was bad. Didn’t like it at all. It was uncomfortable, but it was the length of that where I saw people after a couple of years start to say to themselves wow, maybe this isn’t for me. I mean really almost the exact time when it was the perfect time to buy, it was that length and that loss of confidence in the plan.
It’s important to remember that when you do a financial plan or some kind of a what do you need in order to meet your financial goals, it’s an average rate of return. Let’s say it was five percent. That doesn’t mean that every year you make five percent. By the way I’m just making up that number. It means that 50 percent of the years you’re above five percent and 50 percent of the years you’re below five percent. If one year you had positive 20 (I meant to say negative 20), maybe another year you had negative 15. It was the average of five and that’s what’s real important is to keep that in mind because you can’t just focus on the negative 15 in my particular example here.
I’m going to a chart up on the screen of some bear markets and subsequent bull runs. You can see all the way back to 1928 some of those huge declines. And that red line up there at the top is a 20 percent market decline. What you’ll see is not necessarily just on this chart but I’ve shown other charts that about every year we have a ten percent decline in the market. About every four years we have a 20 percent decline in the market. And about every ten years we have a 40 percent or more. One thing that has been consistent is it has always come back but not always in the timeframe that we would like. We would like it to come back the next day. It just doesn’t quite work that way.
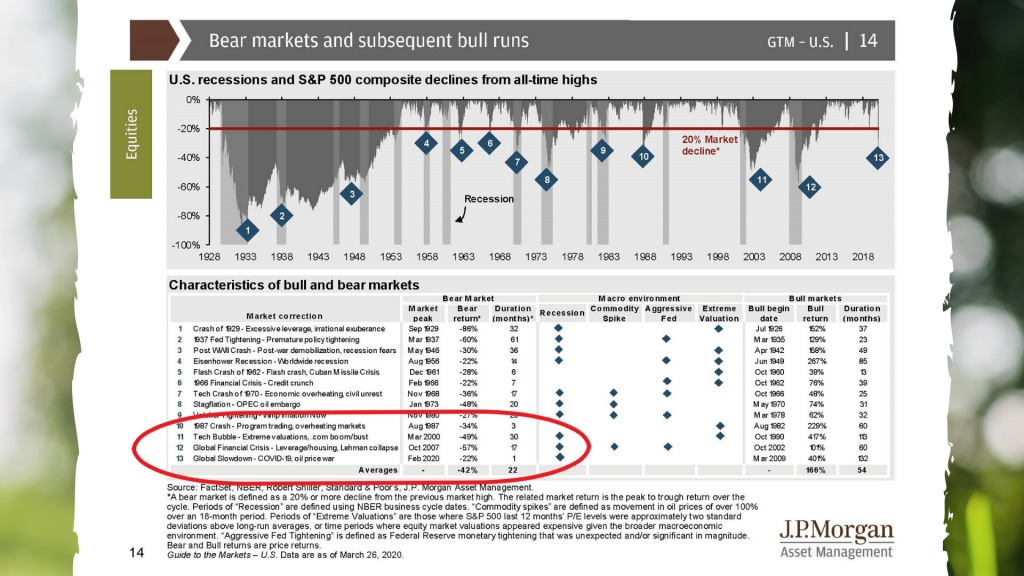
I’m going to focus in now, I’m going to zoom in on the bottom left hand side where that circle is. You’re going to see the last four major corrections and the last one there is the one that we’re in right now. That number, that duration, the number of months. Right now we’re one month into it. See that number one. The last one was 17 months. Thirty months, three months in the 1987 crash. The average was a couple of years.

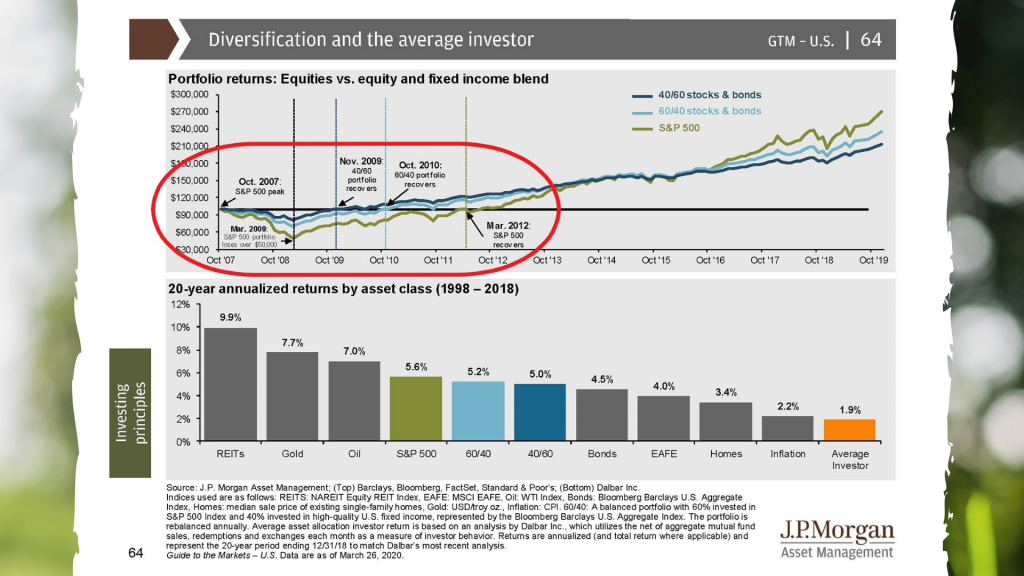
I’m going to put another chart up on the screen. You’ve see this before because I keep using this chart over and over again. If you’re not paying attention well, shame on you. Pay attention. If you were 100 percent in the S&P 500, the unmanaged stock market index, it took you five years give or take to break even from the last financial crisis. It took you either two or three years depending on the allocation of 60/40 stocks or bonds or 40/60 stocks or bonds. It has always come back not when we want it to, but sometimes it takes a little bit longer than what we would like. It’s the when that is going to determine your happiness. And so that’s why I have repeatedly over the last eight, and I say it here again in the number nine, the ninth video in the last two months that it’s the timeframe and the time horizon and your discipline to stay with what you spent years developing and becoming comfortable with. Know that these things happen. When it does happen you still stick with your plan. The people who are going to be, in my opinion, the happiest five and ten years from now are those that look back and say it was absolutely horrible, it was a lesson I wish that I didn’t have to go through but I’m actually wiser because of it and I believe my outcome is better because of it as well.
I’m going to continue to do the videos throughout the month of April. Why? Because lots of stuff happens and I think that this is a great medium in order for you to get clear and concise information from me. Hopefully non-emotional, non-sensational like you get on TV. I’m going to try to be as up front and blunt with you as I can.
Mike Brady, Generosity Wealth Management, 303-747-6455. Thank you. Have a great day. Bye.
