“One moment of patience may ward off great disaster. One moment of impatience may ruin a whole life.” – Chinese Proverb
If you flip a coin 1,000 times–mathematically, 500 times it’ll be head, and 500 times it’ll be tails. However, if you look at the distribution of those heads and those tails, sometimes you’ll have 10 tails in a row, or you might even have 20 heads in a row. It doesn’t mean that the 21st or the 22nd will be either heads or tails. It’s just that they get clumped together. The reason we look at this analogy now is that’s what we’re seeing in the financial market. It’s very painful and no one is happy.
Of course heads and tails is completely random, the financial markets are not, their odds are even better than 50/50! When you look back over 90 years, three out of four years, not 50-50 but three out of four years are positive. In year’s like we’re having in 2022, this can be hard to remember because it’s been a pretty sharp decline, not only on stocks but also in bonds. And there’s a lot of reasons for that. We’re going to talk about it here today.
Transcript
Hi there. Mike Brady with Generosity Wealth Management. Today I want to start off with an analogy. If you flip a coin 1,000 times–mathematically, 500 times it’ll be head, and 500 times it’ll be tails. However, if you look at the distribution of those heads and those tails, sometimes you’ll have 10 tails in a row, or you might even have 20 heads in a row. It doesn’t mean that the 21st or the 22nd will be either heads or tails. It’s just that they get clumped together. The reason why I bring that up is that’s how it feels right now. Every day, every week, every month so far this year has felt like it’s been down. Very painful. I just hate it. Nobody likes it.
One thing that’s a little different from my analogy is, of course, a head or tails is completely random. That is the pure luck of the draw. With investment, and especially when you look back over 90 years – I’m going to put a chart up here in a few minutes that will show since 1980, which is now over 40 years – three out of four years, not 50-50 but three out of four years are positive. But, I’ve got to tell you that this year it’s hard to remember that because it’s been a pretty sharp decline so far this year, not only on stocks but also in bonds. And there’s a lot of reasons for that. We’re going to talk about it here today.
The very first thing I want to show is a long-term chart, and I’ve just put a circle around where we are right now.
Irritating. Absolutely painful and one of the reasons why I am always talking to people about their duration. You can sit back and watch these videos that I’ve been doing for 12-13 years, and in almost every single one I talk about, well, if you need money in the next couple of years, you shouldn’t even have it invested. That’s because periodically, there are these times where the market goes down, the unmanaged stock market indexes, and it takes a while for it to recover. And who knows how long this particular one is going to recover. But I’m going to show you that a balanced portfolio, at least historically, has come back 100 percent of the time. If you’re an individual stock, no, that’s not the case. Things go bankrupt, which is the reason why you stay diversified. Staying diversified, what’s your duration? Those types of things are real nice and cute and almost cliches until something like what has happened so far in 2022 actually happens. And then you remember why it is a core fundamental foundation to investing.
Up on the screen once again is where we are so far this year.
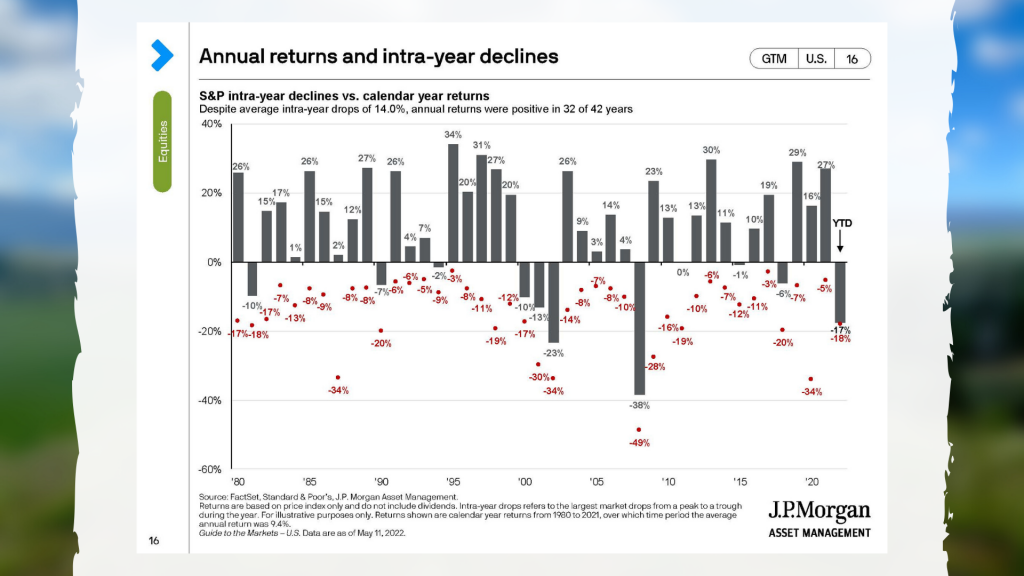
As you look at this next chart, the numbers on the red are the intra-year declines for an unmanaged stock market indexes, the S&P 500. That means that during the year, there’s a decline of that amount. A lot of times, it doesn’t happen at the beginning of the year. Maybe the first half of the year is really good, and then it gives up some of the money. The top number, the black number at the top is the way the year ended, the rate of return. So, just because there’s an intra-year decline does not necessarily mean that the year ends negative. It is too early so far this year; it’s now the middle of May, who knows how the year is going to end. But just because it has started off not good at all does not mean that the year will end negative.
This screen right here, I’ve circled that on the right-hand side.
You’re going to see that depending on where it’s invested, the unmanaged stock market indexes, this is kind of a compilation of them, you’re talking between 10 percent and almost 30 percent negative for the year. It’s really been a broad-based decline so far this year, which is painful for everyone. At least a couple of years ago, when the COVID decline happened, we’d have some up days. It feels like a long time since we’ve had an up day which is absolutely irritating. Sometimes these sequences of returns are not in our favor, and that’s what’s happening right now.
The next page and I’ve now circled it, are the returns for bonds.
Most of the time, stocks and bonds are decoupled, meaning that when stocks go up, bonds go down, and the other way around, bonds go up and stocks maybe go down. Right now, because of the interest rate increases, the bonds have also declined, and they have priced in future expected rate increases. When interest rates go up, bonds go down. They’ve priced it in. So, from my humble opinion, I believe that this is a relatively short correction, an overcorrection in the bond market, that will be corrected as the months play out. At this point, the hit has happened with the bonds. I don’t expect it to be much greater in the future. But, stocks are down, and bonds are down, which really is the core of a portfolio – stocks, bonds, and cash. Cash is paying nothing; bonds are negative this year, and stocks are negative as well, the unmanaged stock market indexes and the unmanaged bond indexes. So, it’s not really been a rosy picture. It’s been very painful, and this is the reason why you have long-term investments. If you’re looking at things on a daily, weekly, monthly, or even quarterly basis, sometimes you’re going to be very disappointed. And that’s when the fortitude, your emotional control, is so important. The best advice I ever give as a financial advisor is to stay in control of your emotions. You don’t take short-term trends and extrapolate it out into a long-term decision.
This next graph that I have on there are corporate profits.
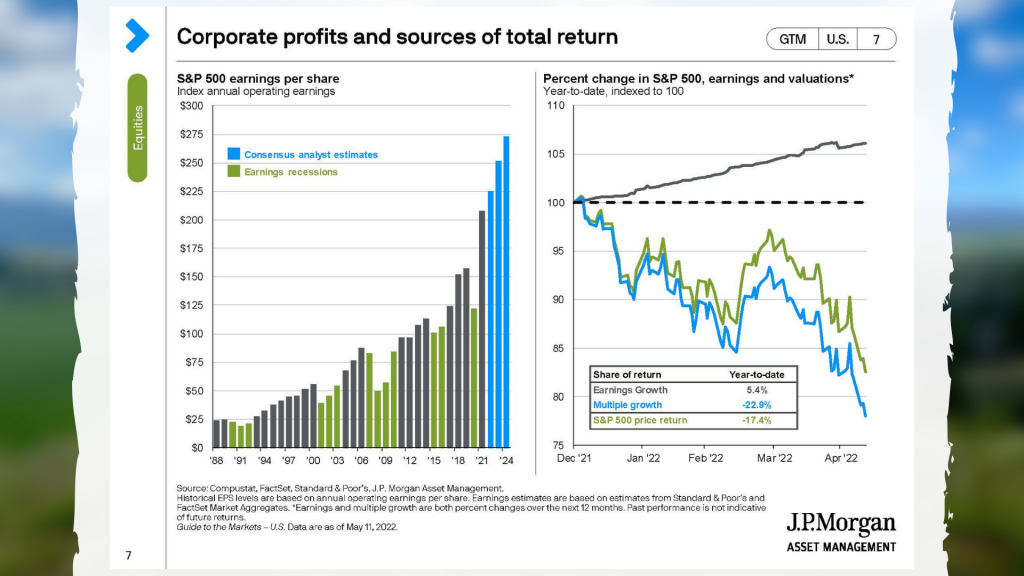
You’re going to see corporate profits are good. When we’re trying to evaluate the future of the market, one of the things that’s absolutely essential is the money volatility which is high, and also what is the cash reserves and the profitability of the things that we might be investing in. That is good. That is a positive sign. That’s something that I’m very happy about.
One thing that we have to remember, this next sheet here, I said earlier that if you have a diversified portfolio, I now have circled five years out, at 50 percent unmanaged stock market index and 50 percent unmanaged stock and bond index.
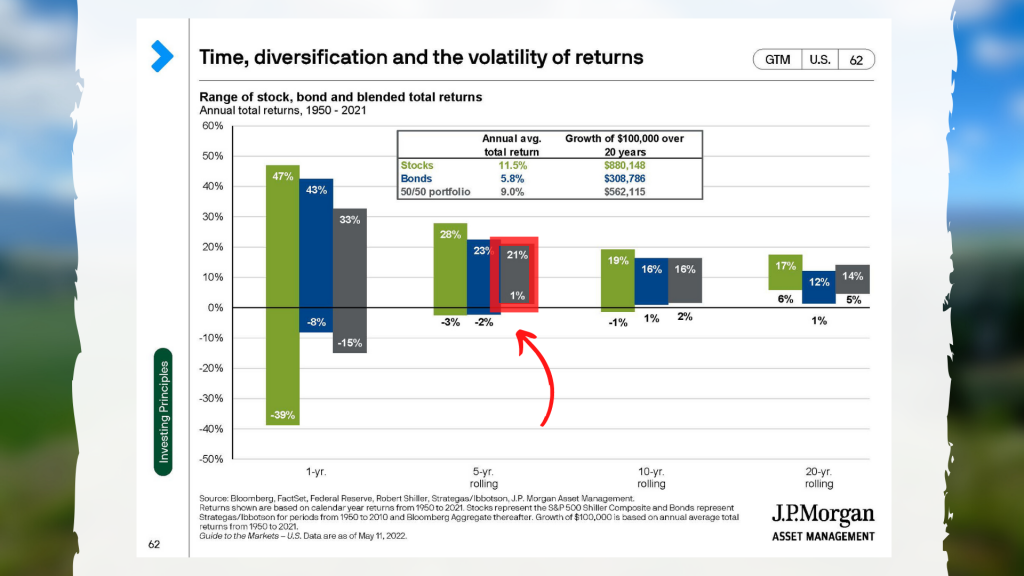
It’s returned, at least going back since this is all the way to 1950, so that’s 50, 60, 70, 72 years you’ve had a 100 percent recovery rate within five years. Now, let’s hope that it doesn’t take five years for us to recover our particular portfolios. It’s gone down. The absolute worst was that. Most recently, we had declines two years ago, right around Christmastime. Well, before that, it was the COVID and that recovered within the year, within nine months. Prior to that, in 2018 there was a huge decline at Christmas and it still ended up about breakeven, just a little bit negative for the unmanaged stock market indexes. But it recovered very quickly within months. When we look back at 2011 with the downgrade of the U.S. government, it recovered very quickly. In 2008 it still recovered very quickly. The worst financial crisis that we have seen in most of our lifetime was still a two to three-year recovery if you had a diversified portfolio. That’s one of the reasons why I’m always talking about you’ve got to know what your duration is. It doesn’t mean you’ve got to like it when you’re underwater. It does mean that you’ve got to be patient. Warren Buffet has a great quote that says, “Corrections like this transfer money from the impatient to the patient,” which is the reason why I always say you’ve got to be patient.
Right around this time, this next chart is consumer confidence.
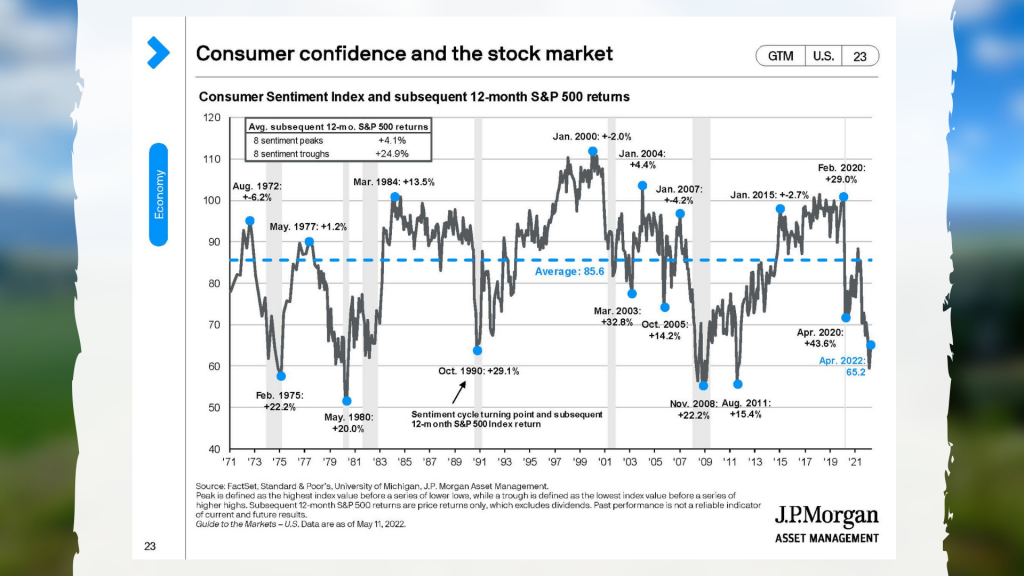
When the market is down, a lagging indicator is confidence. Not a leading, it’s a lagging. Oh my gosh, consumer confidence is at an all-time high. That usually happens after the movement has already happened. In this case, it’s the opposite. Consumer confidence is at a low. That’s because after the fact – and I’m a contrarian – what everybody knows isn’t worth knowing. When everything is going up, then you’ve got to wonder, wait a second, when is it going to go down. When so much has gone down, this is when a contrarian like me says, “Gosh, now is when I might want to put more money in.” If I believe that it’s going to recover and it’s going to be higher in the years going forward from where it is now, don’t I want more invested in the unmanaged stock market indexes. Of course, that just makes sense. But I will tell you that our emotions have this tendency to say well, it’s going up so it’s going to continue to go up so, therefore, you’re buying at the top, and you sell at the bottom. That’s what real investors who do not have professional investment advice many of them do. Not all, but many.
The last chart I want to talk about today is inflation.
It is unbelievable how inflation has shot up in the last year. When we had COVID and the whole world pretty much closed down, we dumped lots of money into the economy and I think that was a wise thing. Otherwise, we never would have been able to restart the economy at any point. This is my opinion, and the opinion of many, many economists is that was a smart thing, but sometimes you can just go too far. A year ago, way too much money was poured in, fiscal bills that were unwise that have thrown so much liquidity in that it increased inflation, and that’s what we’re seeing right now. Yes, there is a strong argument to be made that it’s also through some of the demand that we have when we don’t have the supply in order to meet that demand. I get it. And that doesn’t help that we’ve got China is in lockdown with all of their COVID issues that they’ve got going on. Absolutely. What the value is of these two variables to get to where we are right now, it’s where we are right now. It’s that simple.
A year ago, I have to tell you that especially as these massive spending bills were being passed that there were many economists who were saying that this was going to lead to a high increase in inflation. I even had a couple of clients send me some articles talking about it, and I said, “No, I don’t believe that. Let’s not extrapolate out one or two months’ worth of data into an entire year.” Well, that whole year has now gone by, and yeah, we’ve gotten higher inflation than most of the economists a year go would have imagined including me. So, it’s remarkable that some of the signs were there. It could have gone the other way. I mean, there’s an old joke that economists predicted nine out of the last three recessions. And we’re always thinking, yeah, oh my god, this is horrible. Well, in this case, it was a situation where it has actually turned out worse than most economists have even imagined. And thank goodness there were not even more fiscal bills that were passed that were proposed.
How exactly the supply issue is going to continue to impact things, we’ll just have to watch it very closely. One thing that we have to keep in mind is that there’s always a reason to be pessimistic, and at a certain point you get that out of the system, and then it’s a buying opportunity again. If you’re already invested, then great, you stay invested. If you’re not invested sometimes, it’s a good place to be which is to be in there for any kind of recovery that might happen.
We don’t know when it’s going to happen or how long it will take in order to break even and for us to be in that positive again because frankly, so far this year we’ve give up much of what was gained in all of 2021. We’ve probably taken a 6, 12, 18 months step back to where we were. But what isn’t helpful is to catastrophize. That means if its gone down, you imagine, oh my god, I just don’t want to lose all my money. Just because you’ve made some money, it doesn’t mean you’ll always make money. And just because you’ve lost some money in some timeframe, it doesn’t mean you’ll lose all your money or continue to lose money. It’s not linear. It doesn’t move in a straight line, and so we have to remember that it truly is three steps forward, one step back, and sometimes it’s two steps back. When we look at the past 12 months, it has been three steps back. Three steps forward, three steps back which is absolutely irritating. So, it doesn’t mean that it’s flawed in any way. It’s how we want to view it and, of course, our emotions allowing us to make the decisions that we need to make which is to stay with the plan that we have.
Mike Brady, Generosity Wealth Management. You have a great day. See you. Bye-bye.