One thing to watch out for is assuming the future will reflect the past. As a matter of fact, that whole “past performance is no guarantee of future result” is actually true.
So, looking at history over the past 14 to 15 years, what would happen with your returns and volatility if you had invested for the year based on the best asset class for the prior year?
Inquiring minds want to know.
Therefore, you should watch my video.
Hi there, Mike Brady with Generosity Wealth Management, a comprehensive full service wealth management firm headquartered right here in Boulder, Colorado. Today I want to talk about volatility, I want to talk about diversification and picking an asset class based on the prior year’s returns.
I was at a conference maybe two weeks ago, three weeks ago, something like that and this presenter had these charts, which I’m going to share with you today, that I thought were so fascinating. A lot of it has to do with setting yourself up for success. You’ve heard this if you’re watching my videos, as I certainly hope that you are, about setting yourself up for success because I’ve heard I just want the highest return, volatility doesn’t matter.
Well, my experience has been that volatility only matters when you’re right in the middle of it and it’s happening to you. Therefore, let’s set ourselves up for that success. I’m going to throw up here on the chart an example of all kinds of asset classes that you could have been in. You go back all those years and all the different colors and each one of them are stocks and bonds and international and commodities and all different types of asset classes. Now, let’s pretend like we’ve invested, so the highest one for each one of those years keeps changing because you can see that top row there the color keeps changing. If we took the previous year’s highest, the one who won for that year, and you invest in it the next year, what do you think would happen with your returns?
Well, this chart that I just threw up on the video will show you that the blue line there and this is a little bit cherry picking because this goes back to the beginning of 2000 and if you remember at that time it was right after the internet craze and I remember, I mean I’ve been doing this for 23 years, and the confidence level of all these people were oh my God, you’ve got to get into internet and you’ve got to do this, look at how great it did in ’97, ’98, ’99, I mean you’re a fool if you don’t do this. If you had done that, look at that blue line, the blue line is for the last 13 years if you had picked and invested your money into the previous year’s best asset class that’s what happens, okay. The red is if you invest in the worst asset class for the previous year, but if you invest in a diversified global diversified, meaning global stocks and bonds and some cash, then you’ve got that green one right in the middle. It’s not as good as going right into the worst. It’s definitely better than going into the best, but it also is a slightly smoother ride, which is absolutely essential.
This next graph I think is really interesting in that the red is the 100% stock market index. What would happen if you got only 50% of the decline so if it went down 50, you went down 25, and you only got 50% of the up so that it went twice as much up as you did, you would have that green versus the red, so the red is what you would have if it was $1000 or a million, it doesn’t really matter, but you would have a much higher rate of return with a lot less volatility just by having half of the down and half of the up because if you recall losing 50% means you have to have a 100% return just to break even. If you have $100 and you lose 50, that’s $50. You have to make 50 on 50 just to break even. If you lose 20% you have to make 25 just to get back, lose 33 you’ve got to make 50, that’s just the way math works.
There was one other chart that I really wanted to share with you. This chart right up there, this is my last one for the day, which is on the right-hand side there, the question is the cycle of emotion. You go through some caution, some confidence, enthusiasm and greed, and then you go to indifference, denial, etc., all the way down there, so our emotions. I’m a behavioral finance guy who’s interested in that, that some of the nontechnical aspects that we bring to investing are as important, if not more important than some of the technical aspects. I just acknowledge that and so I’m always wanting to set ourselves up for success. These are the types of things that I talk with clients about all the time and if you are not one of my clients I’d love to talk with you about it.
Mike Brady, Generosity Wealth Management, 303-747-6455. Have a great week. We’ll talk to you later. Bye-bye.
The first quarter is now behind us, but all the excitement happened in the first week of April!
After reaching new highs, the unmanaged stock market indexes pulled back a little bit, so the question we have to ask ourselves is “what does this mean for the rest of the year?”.
Good question, and one I answer in the below video:
Hi, this is Mike Brady with Generosity Wealth Management, a comprehensive full-service wealth management firm headquartered right here in Boulder, Colorado, and today I want to talk about the first quarter review and the rest of the year preview, but I also want to talk a little bit about time horizons and our perspectives, recency bias, a confirmation buys, those things of things.
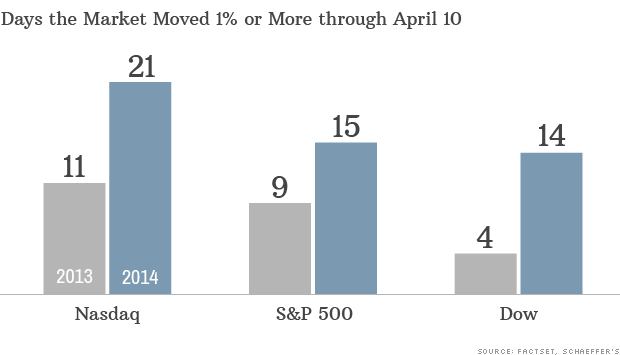
The first quarter review is both stocks and bonds, unmanaged stock market and bond indexes were positive for the quarter. Bonds were really bad in 2013 and if you could go back to 2013, you’d have no exposure to them. Well, you were vindicated in the first quarter. They were really what brought up a balanced portfolio for the first quarter of this year. The stock market started off well in January; we only kind of stumbled; dropped around 6% at the S&P. The unmanaged stock market index S&P 500 dropped about 6% through the middle of January to the middle of February and they kind of came back and of the dictating this video, I’m not – let’s see, this is April 8, Tuesday – that we’ve given up some of that gain that we had in the first quarter, so we’re about breakeven for the year in the unmanaged stock market indexes. I think that it’s real important to know what your time horizon is and the reason why I bring that up is if your time horizon is weeks or months or if you need the money for some kind of a purchase in a year or two, these kind of fluctuations could be really kind of scary; however, we’ve got to take a big picture on this and really look at it from the long point of view, because if you’ve ever held up like a piece of paper that had some ink on it really close to your eyes, you can see the actual droplets of the ink. It’s only when you go backwards, kind of some distance from it that you can really see how everything kind of fits together. I’m going to put up on the screen there the S&P 500 for about the last, let’s see, what is that, 14, 15, 16, 17 – 17, 18 years or so, and you can see that it goes up and it goes down, et cetera, and so the question we might have is this big upward swing there. I’ve frankly been hearing from people for two, three, four years about how, oh, we’re at the top again, and then when it hit those new highs a year or two ago, oh my, gosh it can’t go any further.
Well, you know they always joke that economists have predicted 15 of the last three recessions, okay, and so it’s always easy to be negative. It’s a little bit more difficult to be positive. I’m going to put up on the screen there again; this is annual returns in intra-year declines. You can kind of see that far right-hand side there, the year-to-date number and then that red number underneath is that we had a 6% decline throughout the year. That was the maximum decline that we had for all of last year, so it’s actually been relatively low historically from a top to a bottom within a year, so that’s something to keep into consideration.
I am still optimistic for the rest of the year. One thing that we have to watch out for as it relates to data is we have a tendency to extrapolate short-term events and say, wow, that’s what’s going to happen for a long-term and it just doesn’t work that way. Just because things have gone up doesn’t mean they’re going to continue to go up. Just because things have gone down doesn’t mean they’ll continue to go down and so we place more emphasis on recent information than maybe data that is six months, 12 months, or even three years old. When we look up at this one screen that I just threw up there on your video is interest rates and equities. From the left to the right is the yield that you have on your 10-Year Treasury, which as of this chart creation was 2.72; as of today, it’s actually about 2.67. Not important to know that except to the degree that the correlation between a rising, where the yield is going from 2.7 to 3 to 4 that the market is actually continuing to go up, and so they have moved in lock stock in the past.
I’m going to put up another screen there. You’re going to see that circle there. Lots of corporate cash that has continued to be a very strong thing as I see. Quantitative easing has thrown so much money into the system that that is continuing to prime the pump. If you look over on the right hand side, there, that second circle that I just did, cash return to shareholders, lots of profitability and cash being returned. Now, today’s video I’m going to make relatively short, because I’m going to try to do more videos, but make them shorter. I’ve been kind of bad this past two months or so and I just unbelievably busy. Even I want to make this short and pithy.
Diversification, while in a generally trending down market does not guarantee that you won’t lose money; it is a very wise thing to do. On the pie chart on the top left is your stocks, your bonds, your internationals; and then on the right hand side you’re going to see an even more diversified portfolio adding in some real estate investment trusts and other things like that. One of the things that I’ll be doing for the appropriate clients going forward is diversifying out. I do believe in diversification, because if this past quarter is any indication, sometimes it’s the bonds that hold up your portfolio, sometimes it’s the stocks that are the driver behind your portfolio. I think that the standard deviation, the variance, the ups and downs, the volatility is very important, because we want to set ourselves up for success and unfortunately your average investor buys at the top and sells at the bottom and really hurts themselves.
We want to set ourselves up for success by creating a portfolio that hopefully will have reduced volatility so that when the market does go down, which inevitably it does at various points, whether that’s a small decline or a larger decline, whether or not that’s a quick recovery or a longer recovery, we want to be well prepared for it with a time horizon that is long, but also not be the dump money and sell at the bottom. That bar graph at the bottom, where you’re going to see is on the far right-hand corner, the average investor, when we take into consideration inflows and outflows of the stock market, mutual funds, things of that nature, unfortunately does the wrong thing at the wrong time and we simply don’t want to do that. I continue to be optimistic for 2014; I have not changed from that. I encourage you to go back to my January video and I lay out in 17 minutes or so an argument for that – that has not changed. I’m not freaked out. I am completely, if you can see my hand there, I’m completely rock steady, so that’s where I am.
I am going to continue to add a couple of extra asset classes to sell clients, and many of you, I’ll be talking with you about that. Some of the upcoming videos I’m going to do is I’m going to read Michael Lewis’s Flash Boys on the high-frequency trading. Everybody get, but I’m going to dissect that and give my opinion. I also want to really talk about social security; I want to do a whole series frankly on social security and Medicare, retirement and all of those things, because I think that’s very relevant. One of the values that I can add is what’s the right stuff to own, what’s your withdrawal strategy, et cetera, and I just find it all fascinating and I think it would be a great value to you.
If I can help you out in any way, please give me a call. Mike Brady, 303-747-6455. Stay tuned for another newsletter after this one. Have a great week. Bye-bye.
Twelve months ago, the 5 year return for the S&P would have covered 2008 – 2012, for a +1.66% annual return (including reinvested dividends). Today and one year later, because a bad year dropped off (2008) and is replaced by a good year (2013), the 5 year annualized return jumps up to +17.94%.
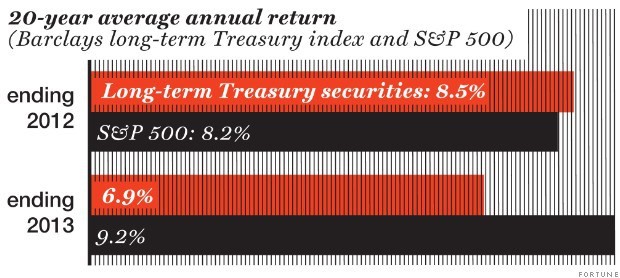
Let’s look at another longer term statistic. A year ago, the 20 year annualized S&P 500 return was +8.22% a year vs. +8.50% a year for long term Treasuries. Makes the argument that you should put all your money in long term treasuries, right? I mean, the annualized 5 year return for the S&P 500 was just +1.66% and it underperformed the 20 year annualized Treasury return.
Had you done so, you would have lost -12.7% last year (as measured by Barclays index of long-term Treasuries), and missed out on 2013’s 32.4% gain for the S&P 500. The 20 year track record in one year has changed the 20 year average to +9.22% for stocks vs. +6.92% for Treasuries.
One of the most important lessons investors need to keep in mind is the “non-linear” nature of investments. Just because a particular investment (whether it is stocks, bonds, or some sector) has done well in the past does not mean it will do well in the future. And, the opposite is true as well.
When I give advice to clients, it’s taking the past into consideration, but it’s present and future focused.
2013 was a great year for stocks/equities in general, and pretty bad for bonds. If only we could rewind the year and go 100% in stocks.
But would that be wise? Sure, in hindsight and only since we know how it turns out. But investing doesn’t work that way. We work in the unknown, crafting a disciplined investment strategy that helps a person reach their goals.
I have a full 2013 recap and 2014 thoughts in my video, so I highly recommend you watch it.
Hi there, Mike Brady with Generosity Wealth Management, the comprehensive full-service wealth management firm headquartered right here in Boulder, Colorado. Today I want to talk about 2013 and 2014. We’re going to go over some graphs and charts together. I’m going to walk you through it. I also first want to talk about the big picture. Now, I’m going to use an analogy here if somebody wants to be healthy in their body and maybe lose some weight and just generally better fit. You might go to a nutritionist and set up a goal by how much they want to lose by a certain point in time. My experience has been that those people who lose that weight, consistently meet their healthy goal are sometimes the most disciplined individuals. They know where they’re going, they make tweaks and adjustments along the way no questions about it, but they are very very disciplined. The reason why I bring that up is it’s the same way in the financial world in my experience.
Twenty years ago I did financial plans for people and some people, now that we fast forward today, some people have met their goals and some people have not. It’s those that did not meet their goals usually not because they bought a mutual fund A and mutual fund B or they bought the wrong investment. It usually was because they weren’t quite as disciplined as the person who has now met their financial goal. The person who has met their goal knew where they were going, they had that financial plan, they stuck to it, and they didn’t get too side tracked by the bright shiny objects. Sort of like with that health person somebody that knows what they’re doing and sticks to it, but they’re not going through the popcorn diet one week or the pumpkin diet the next or maybe even the grapefruit diet, whatever the National Enquirer diet of the week was. The financial world is very similar in that they absolutely made tweaks along the way, they make some adjustments, but they’re also quite disciplined and understand that they’re trying to get to a goal with the least amount of disruption along the way.
The reason why I bring that up is 2013 was a year where if we could rewind it 12 months ago you would say let’s go 100% into the unmanaged stock market indexes of some type because they did very well in 2013. The Dow to the S&P with joint managed stock market indexes between 26% and almost 30%. One of the tendencies is I think for people to say wow I’ve got to have all this equity exposure going into 2014 or 2015, and the disciplined enough need to say that is not the reason why you do it because why you would go into a higher equity position for 2014 and 2015. It also was not very helpful to say oh gosh I should have had it and I meant to do it and I knew it was going to be a good year, we don’t know that, that is all mental head garbage about what was known at that particular point 12 months ago. In the construction of a portfolio let’s keep in mind that each client and you are one of those people who are trying to get to a certain point in the future and we need to keep disciplined as we’re going towards them.
This past year you’ve got stocks and bonds and you usually mesh them together like this, you might have other kind of satellites around there whether or not it’s real estate or gold or other types of maybe satellite investments from your core investment and sometimes the stocks bring up the whole portfolio. Sometimes the stocks bring the whole portfolio down. This year the stocks brought it up, the bonds kind of brought it down, and depending on your percentage allocation between stocks and bonds because each investment is different with their particular goals and objectives, things of that nature, depends on what your rate of return was for 2013. Bonds did not do well last year. Last year was one of the worst years for bonds in a very long time and so in hindsight you wish you had zero bonds, but no it still makes sense for you to have an allocation of both stocks and bonds and it’s my belief that bonds were actually oversold and it still has a great place in your portfolio.
I’m going to throw a chart up on the screen there and what you’re going to see is for 2013, that green right up there junk bonds did really well. It also correlates very highly with the stock market. Beyond that pretty much all the bond indexes were negative, whether or not that was muni, whether or not that was a treasury; pretty much all the bonds were negative for last year. Why did 2013 turn out to be so good for the equity markets? As we look back at it what you’re going to see is there are some hurdles that were removed. You’ve heard me for a long time talking about the continent of Europe and all the issues that are there, but the European Central Bank made some overtures that they’re going to help backdrop some of the government problems. It hasn’t come through yet, but they have said that and the European markets last year did very very well, in the 20% in general. Even though the economy is growing very slowly, so there is a disconnect between what the economy is doing, but also what the stock market had done and that’s a real key thing that you’re going to hear me say a couple times here in this video is what the economy is doing does not necessarily equate to the performance of the stock market, either good or bad.
We also had a lot of fiscal cliff issues the past year, but they really had a minor impact. I mean 10 out of 12 months last year were positive for the stock market, so that tail wind is up. Plus we need to look at the financial profit and growth, Expenses are very low in companies their profit margins are very high. Look up at that sheet there. I put on there the corporate profits right there at the top there. Profit margins are very high, which I think is good and I think bodes well going into 2014 and 2015, particularly because of the amount of cash that has been kind of thrown into the market through all of the quantitative easing and all of the fed action. One of the things that we’re going to hear an awful lot about in 2014, is whether or not there is going to be a tapering. I think that if things continue as they have been going for the last six to 12 months we’re going to hear more and more about that tapering. If December has shown anything the tapering has already started, though was not in effect. The amount of cash, I think of it as a bowl we put lots of money in, just because we’re not putting more money in doesn’t mean that all the money that has accumulated in that bowl just automatically evaporates. No, it’s still there ready to be invested and ready to be loaned out, etc. In 2013, we also had a lot of stock buy backs. We also had a lot of dividends and earnings that were distributed, so it was just absolutely a great year for the stock market as a whole.
I wanted to show you this next graph here or next chart, it’s the S&P 500 price of earnings ratio. That’s something that you’re going to hear an awful lot about going forward. Right now you can see that at 15.4, that’s the price over the earnings and earnings went up. The prices went up quicker than earnings, so the number has gone up. It is higher than it was a year ago still below the 15-year average. That 15-year average also include those crazy 1997, 1998, and 1999 years when the S&P PE ratio was in the 30s and the 40s. I remember those times and it was crazy. You’re going to see that from a real earnings chart up on the screen right now the trailing it is still cheap. The reason why that number is going down is only because it’s relative to the price and so the prices have gone up faster, but it’s still relatively cheap. You can see that dotted line when it gets below that dotted line is when it starts to get more expensive. Now you’ve heard me talk about the bond markets doing poorly last year. This is a 70% increase in a 10-year yield in 2013; you don’t need to know everything about that yield. I have to admit I’m a little bit of a 10-year yield nerd; I love to watch it on a daily basis. When the yield goes up the reason why the yield has gone up is because the price of the bond has decreased. Now here is a long-term trend, but in one year it really spiked up. You can see it right then and there. Then you might say to yourself “oh my God it’s at almost 3% right now, if it continues to go up then the stock market obviously is going to go down. That’s not necessarily the case.
Look at this next chart here and what you’re going to see, and I’m going to kind of put some arrows there about where we are right now, that’s the correlation meaning a correlation of one is two things move exactly the same way. If one goes up the other goes up in equivalent of that’s a correlation of one. If one goes up a little bit, 10% let’s say, and the other one goes down 10% that’s a negative one correlation. The correlation is still positive meaning that when one goes up the other continues to go up as well until the 10-year yield gets to be about 5. Then there seems to be a real opposite between what the bond yields do, which is based on the bond price going down, and the stock market price going down as well as money is flowing into those bonds to get the higher yield. Let’s talk about what happened in 2013 for the global market. You can see that European, Australia, and far east did very well last year just like Europe did, Pacific did, and emerging markets did not do as well last year. What is interesting is this, this next chart there; all the emerging markets are on the top. The emerging market GDP growth, which is the national income of that country is all between 4% and let’s say 8%, but their markets did not do that well.
When we look at the bottom chart you can see the developed market, that’s the U.S., the UK, Europe, etc., and our year over year growth has been around 2% or so, but yet our market says almost in the high 20s, so there is a disconnect between the magnitude I would say between what happened with the GDP, but also the particular stock market. A lot of it has to do with is it already overpriced, did it go too fast and now something else is trying to catch up to it. That kind of concept of the economy does not necessarily mean that the market is going to do exactly the same. One thing I want to throw up on the chart again is the annual returns per year going back oh a good long time, a good 30 years and you’re going to see that most years, those red numbers down there, most years there is a decline of a double digit.
Now let’s kind of talk about 2014. It is difficult to make a prediction about the future. It’s just that simple and frankly I’d avoid the whole thing if I could, but everybody expects it. I think we need to take it with a grain of salt and this is going to get back to our discipline here in just a little bit. I am optimistic for 2014 and 2015. I stay behind what I said 12 months ago, which is that we ought to have good managers that take advantage of some trading ranges and if we have a whirlwind like we did last year, great, we positioned ourselves to be a part of that because we have a diversified portfolio, if 2014 turns out to be negative. Then we still need to have some bond exposure because I believe the bonds will do well if the stock market does poorly. As we create this portfolio together I think we have to probably increase our equity exposure in general, that’s what I’m doing in general, but each client is specific. Please don’t make changes if you’re not a client of mine without talking to me or really talking with her specific advisor. If you’re one of my clients you know that I’m going to be talking with you about that. We’ve got to be disciplined in regards to not getting crazy.
The thing that makes sense for you and your goals to be a conservative investor don’t start going I want to go all equity or I want to go aggressive, etc. because one of my jobs with you is to be a behavioral finance guy meaning that the exuberance and the excitement to say oh my gosh let’s double down, let’s go all in, real investors unfortunately many times buy at the top of the market and sell at the bottom of the market and we want to be the smart money and not do that. We want to be the smart money and many times invest and stay disciplined to our plan even when we’ve got some bright shiny object or a new diet plan has come up, etc., we want to kind of quick make adjustments. That’s what I’m doing with some of my client’s portfolios, is making those adjustments, but also sticking to what we have, which is a diversified portfolio perhaps a little bit more equity exposure, but not getting crazy on it. The reason why I’m a little bit more optimistic going into 2014 and 2015, is the amount of cash that we have in there, the great efficiencies that we’re having that it’s going to continue to play out I believe in 2014 and 2015, for companies. I think that some of the tapering is not going to affect things as greatly as so many people feel and so I think that’s going to be maybe not a nonevent, but a big enough event as we think going forward.
That’s it, that’s my year-end review. That is kind of my 2014 preview, but my biggest thing is the safe discipline with having good portfolios. If somebody reaches their goal before you so what, you’ve got your goal, your plan, your risk tolerance, you stick to it. You stick to that particular plan. It might sound boring, but you know what, sometimes boring wins the race. Mike Brady, Generosity Wealth Management. I’d love to hear from you 303-747-6455. You have a wonderful day, thank you.