Twelve months ago, the 5 year return for the S&P would have covered 2008 – 2012, for a +1.66% annual return (including reinvested dividends). Today and one year later, because a bad year dropped off (2008) and is replaced by a good year (2013), the 5 year annualized return jumps up to +17.94%.
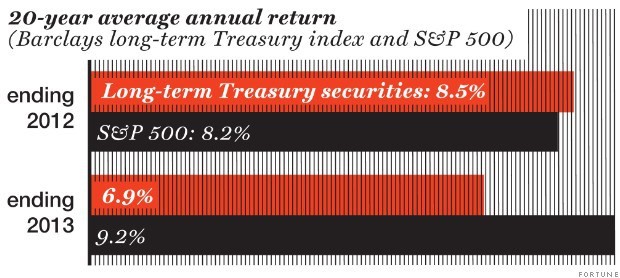
Let’s look at another longer term statistic. A year ago, the 20 year annualized S&P 500 return was +8.22% a year vs. +8.50% a year for long term Treasuries. Makes the argument that you should put all your money in long term treasuries, right? I mean, the annualized 5 year return for the S&P 500 was just +1.66% and it underperformed the 20 year annualized Treasury return.
Had you done so, you would have lost -12.7% last year (as measured by Barclays index of long-term Treasuries), and missed out on 2013’s 32.4% gain for the S&P 500. The 20 year track record in one year has changed the 20 year average to +9.22% for stocks vs. +6.92% for Treasuries.
One of the most important lessons investors need to keep in mind is the “non-linear” nature of investments. Just because a particular investment (whether it is stocks, bonds, or some sector) has done well in the past does not mean it will do well in the future. And, the opposite is true as well.
When I give advice to clients, it’s taking the past into consideration, but it’s present and future focused.
So, don’t be a slave to history.
Don’t be a slave to history – Full Article